

Question: Data for these 23 stores is shown in Table 1 below: Store No Prior Year's Sales Current Year's Sales Current Year's Inv Square ft
Data for these 23 stores is shown in Table 1 below:
Store No | Prior Year's Sales | Current Year's Sales | Current Year's Inv | Square ft | Avg. Number | Sells Lottery |
Full Time Employees | ||||||
1 | 781,793 | 48,725 | 2,500 | 11 | 0 | |
2 | 1,165,221 | 1,146,438 | 44,171 | 2,500 | 11.31 | 0 |
3 | 1,147,430 | 1,195,004 | 45,714 | 2,500 | 12.46 | 0 |
4 |
| 951,784 | 37,218 | 4,000 | 11.86 | 0 |
5 | 2,037,463 | 1,981,409 | 45,826 | 4,000 | 10.06 | 1 |
6 | 2,257,920 | 2,300,671 | 53,862 | 4,000 | 11.1 | 1 |
7 | 1,850,354 | 1,956,481 | 49,883 | 4,000 | 10.71 | 1 |
8 | 1,916,884 | 1,799,713 | 47,016 | 4,000 | 7.5 | 1 |
9 | 1,833,209 | 1,820,641 | 59,726 | 4,000 | 14 | 0 |
10 |
| 774,954 | 35,882 | 2,500 | 11.2 | 0 |
11 | 980,484 | 1,159,004 | 37,664 | 2,500 | 11.6 | 0 |
12 | 1,069,652 | 1,139,475 | 34,662 | 2,500 | 12.7 | 0 |
13 |
| 948,522 | 44,782 | 4,000 | 11.86 | 0 |
14 | 1,795,123 | 1,984,777 | 38,774 | 4,000 | 12.2 | 1 |
15 | 2,119,015 | 2,293,847 | 55,423 | 4,000 | 11.1 | 1 |
16 | 1,947,303 | 1,984,722 | 52,884 | 4,000 | 10.4 | 1 |
17 | 1,705,789 | 1,798,336 | 46,834 | 4,000 | 8.84 | 1 |
18 | 2,396,971 | 2,484,503 | 53,772 | 4,000 | 12.1 | 1 |
19 | 1,901,631 | 1,837,400 | 43,982 | 4,000 | 9.7 | 1 |
20 | 1,514,798 | 1,609,385 | 44,893 | 4,000 | 7.2 | 1 |
21 | 1,886,587 | 1,874,229 | 37,665 | 4,000 | 10.5 | 1 |
22 | 698,333 | 33,826 | 2,500 | 10.5 | 0 | |
23 | 1,092,908 | 1,198,229 | 44,857 | 2,500 | 10.9 | 0 |
Totals | 30618742 | 35719650 | 1038041 | 80000 | 250.8 | 12 |
Source: AICPA
Five of the 23 stores (stores 1, 4, 10, 13, and 22) opened during the year. Operations vary by geographic location and the mix of products sold.
The location of a store is based on several factors, such as competition and the economic environment of the location. Stores 2, 4, 6, 8, 9, 11, 13, 15, 17, 18, 20, 21, and 23 are considered to be in favorable locations.
Typically, a store's operations do not change much unless a new product line is introduced, such as providing lottery tickets and offering check-cashing services. The mix of products and services can vary, and the most important factor is whether the store sells gasoline. Assume you are the senior auditor for the audit of Quicky Stores. The CFO is asking, given the above table and charts presented in this case, why is their such a difference in revenue among the stores. To complete this analysis you must answer each of the following questions. Remember your focus is on revenue.
Data Visualization
Given the sales data provided on the 23 stores in Table 1, the senior auditor decided it would be beneficial to create visualizations to find additional information underlying the data. Thus, the senior auditor put together the five charts below.
Figure 1: Quicky Stores, Current and Prior Year Sales in Store ID Order as Presented
Store Sales, Current and Prior Years
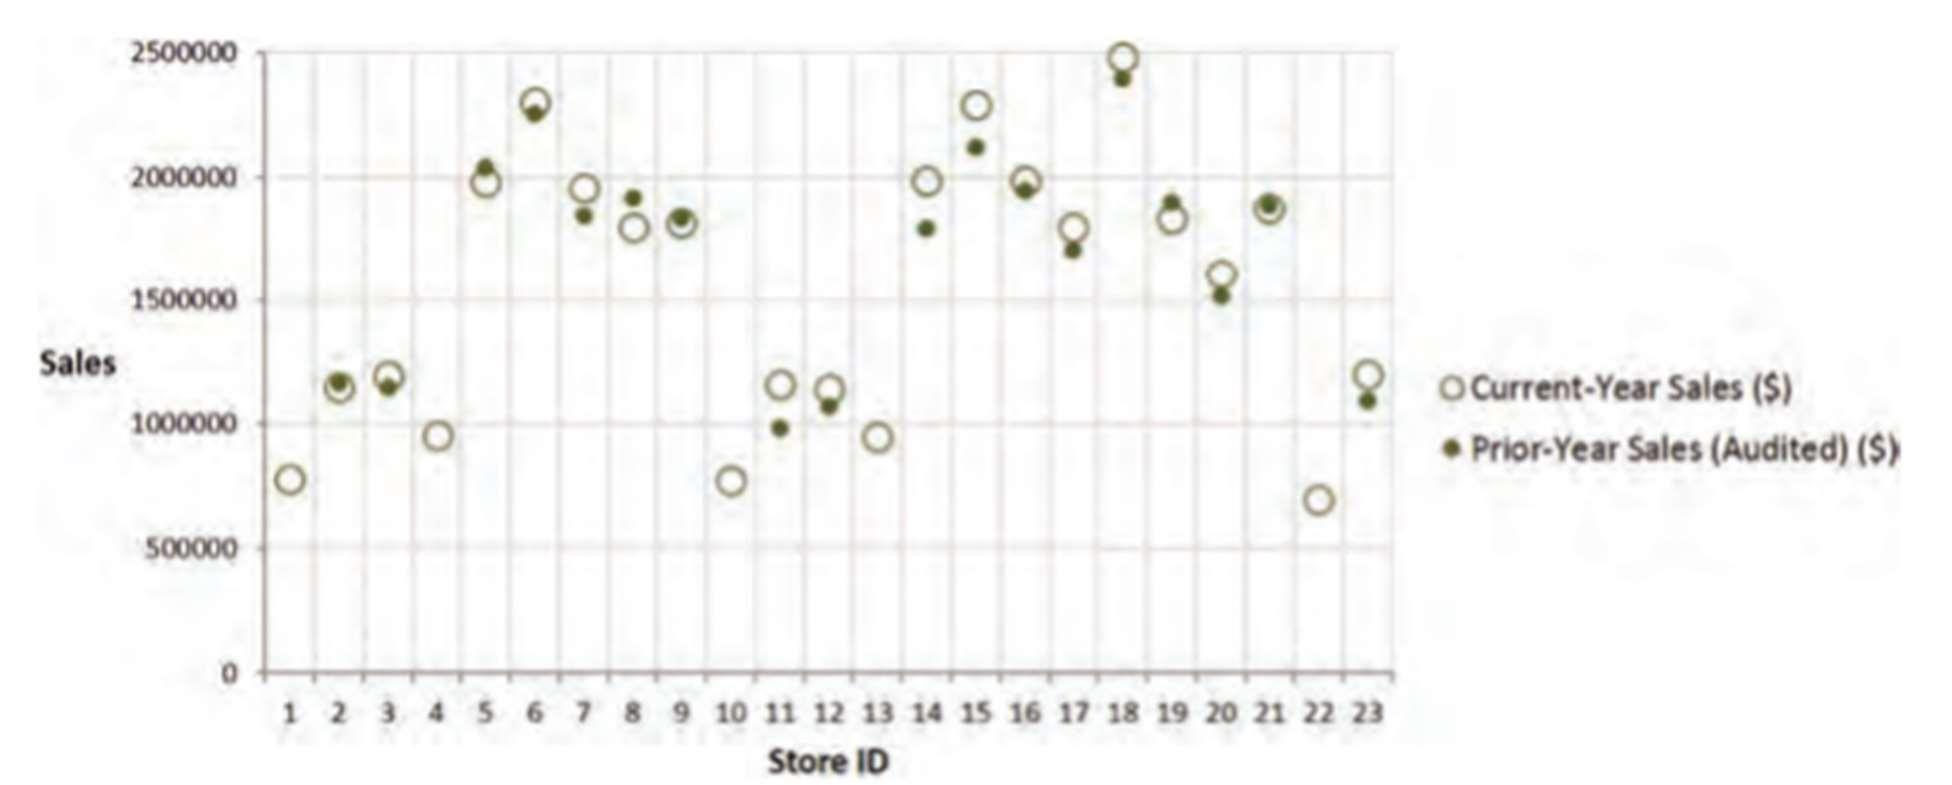
Figure 2: Quicky Stores, Current and Prior Year Sales in Store Sales Order Showing Stores Selling and
Not Selling Gas as Separate Series Store Sales, Current and Prior Years, in Sales Order
Store Sales, Current and Prior Years, in Sales Order
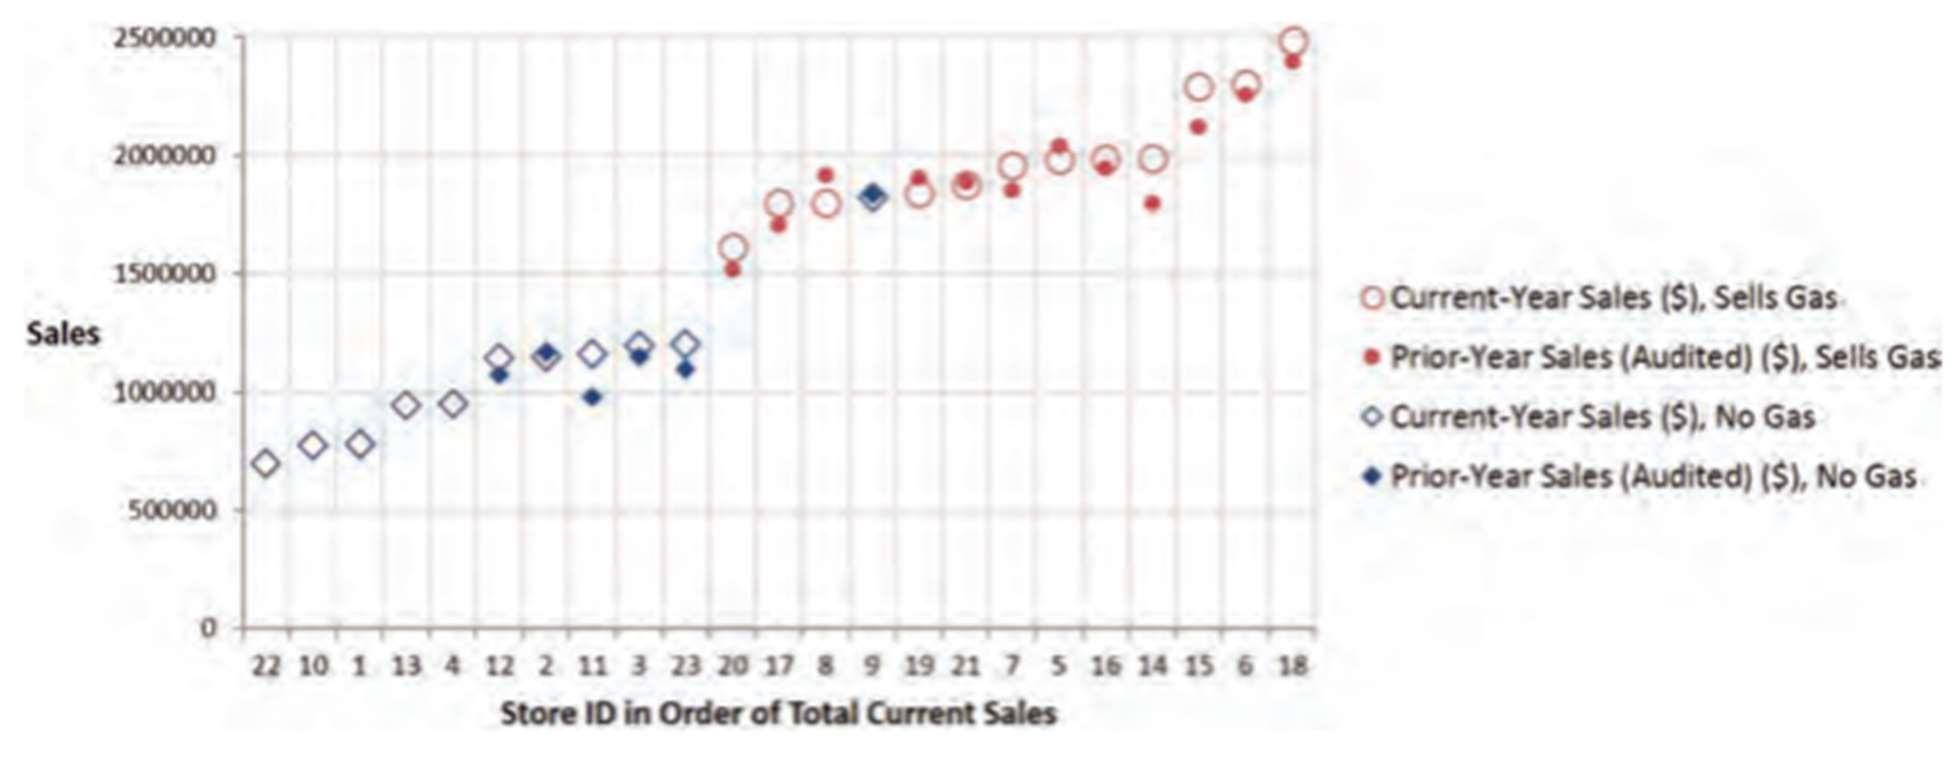
Figure 3: Quicky Stores, Sales per Square Foot by Store Compared with NACS Benchmark Sales per
Square Foot Compared with NACS Benchmark ($490)
Sales per Square Foot Compared with NACS Benchmark ($490)
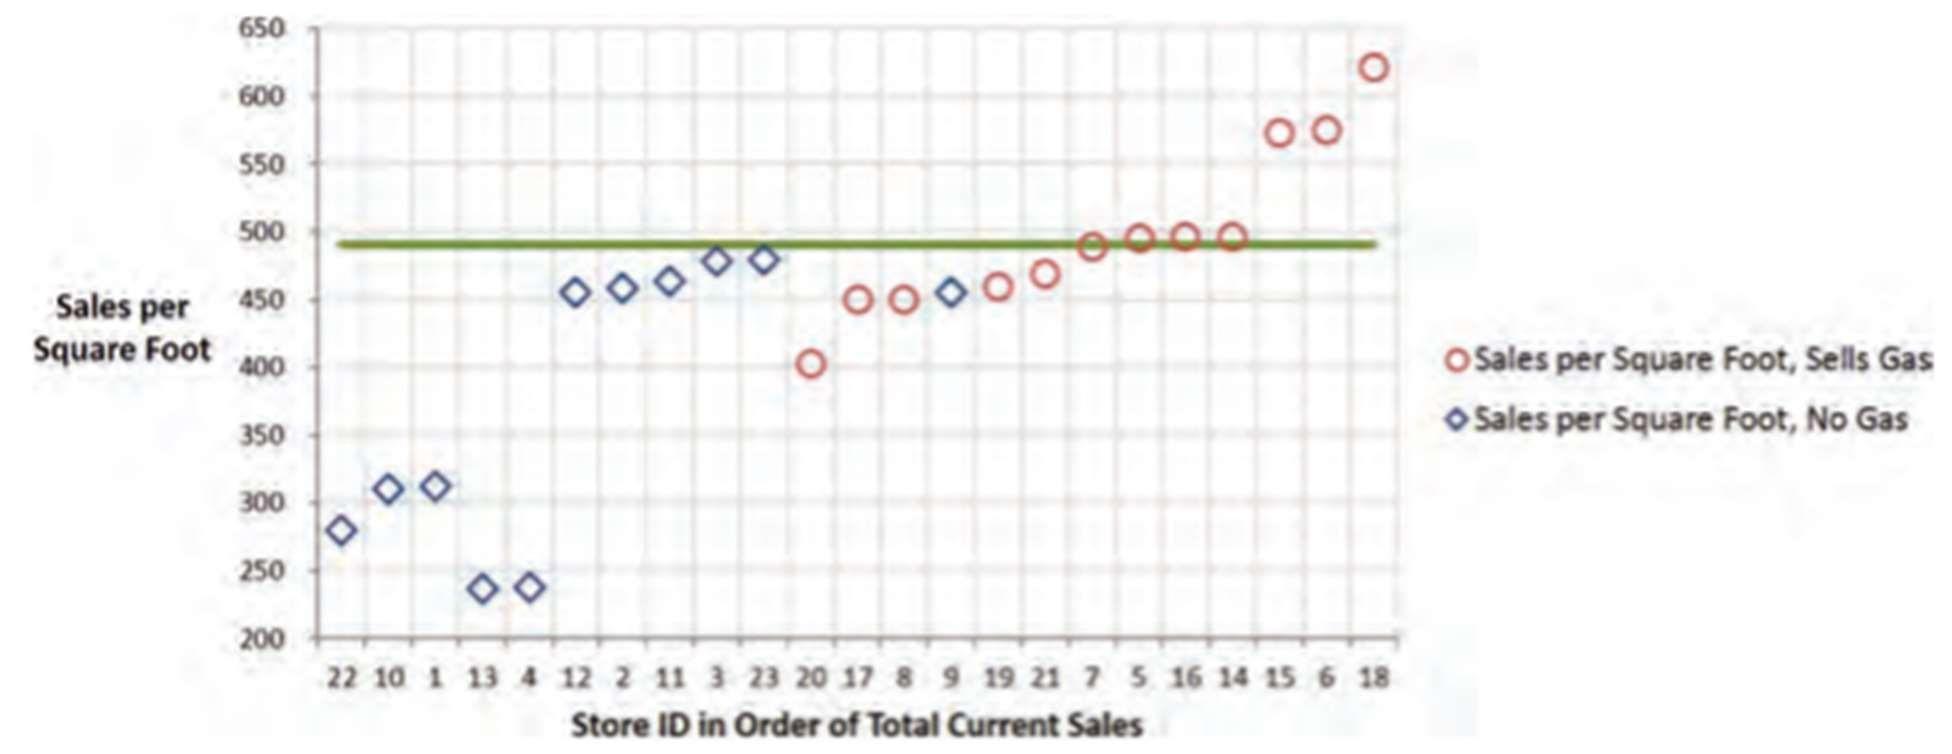
Figure 4: Quicky Stores, Inventory Turnover by Store
Inventory Turnover
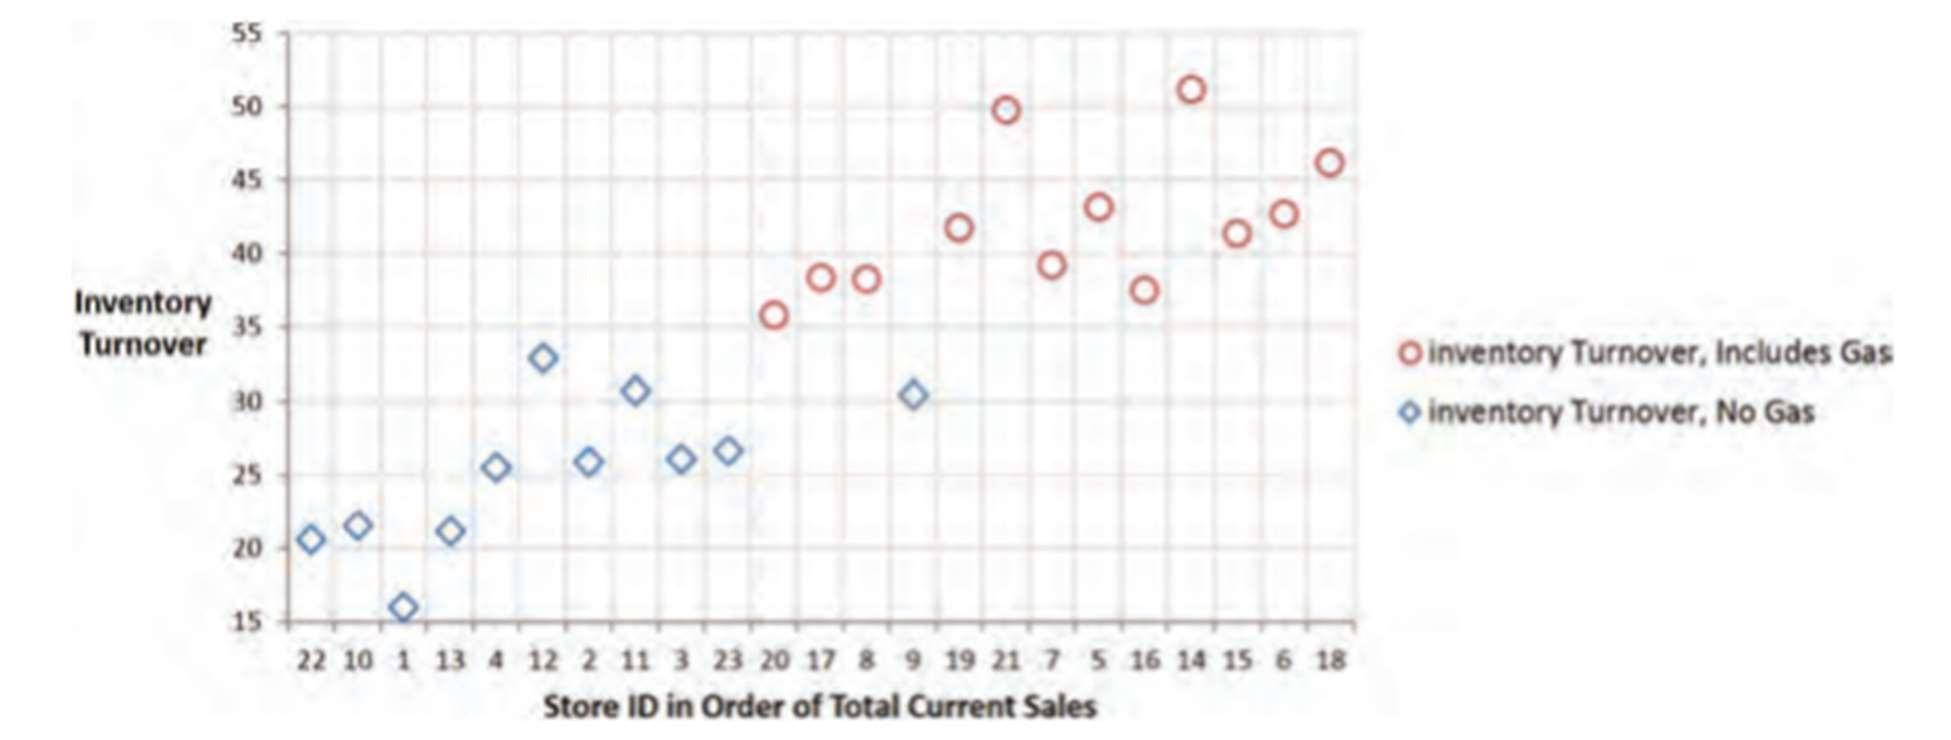
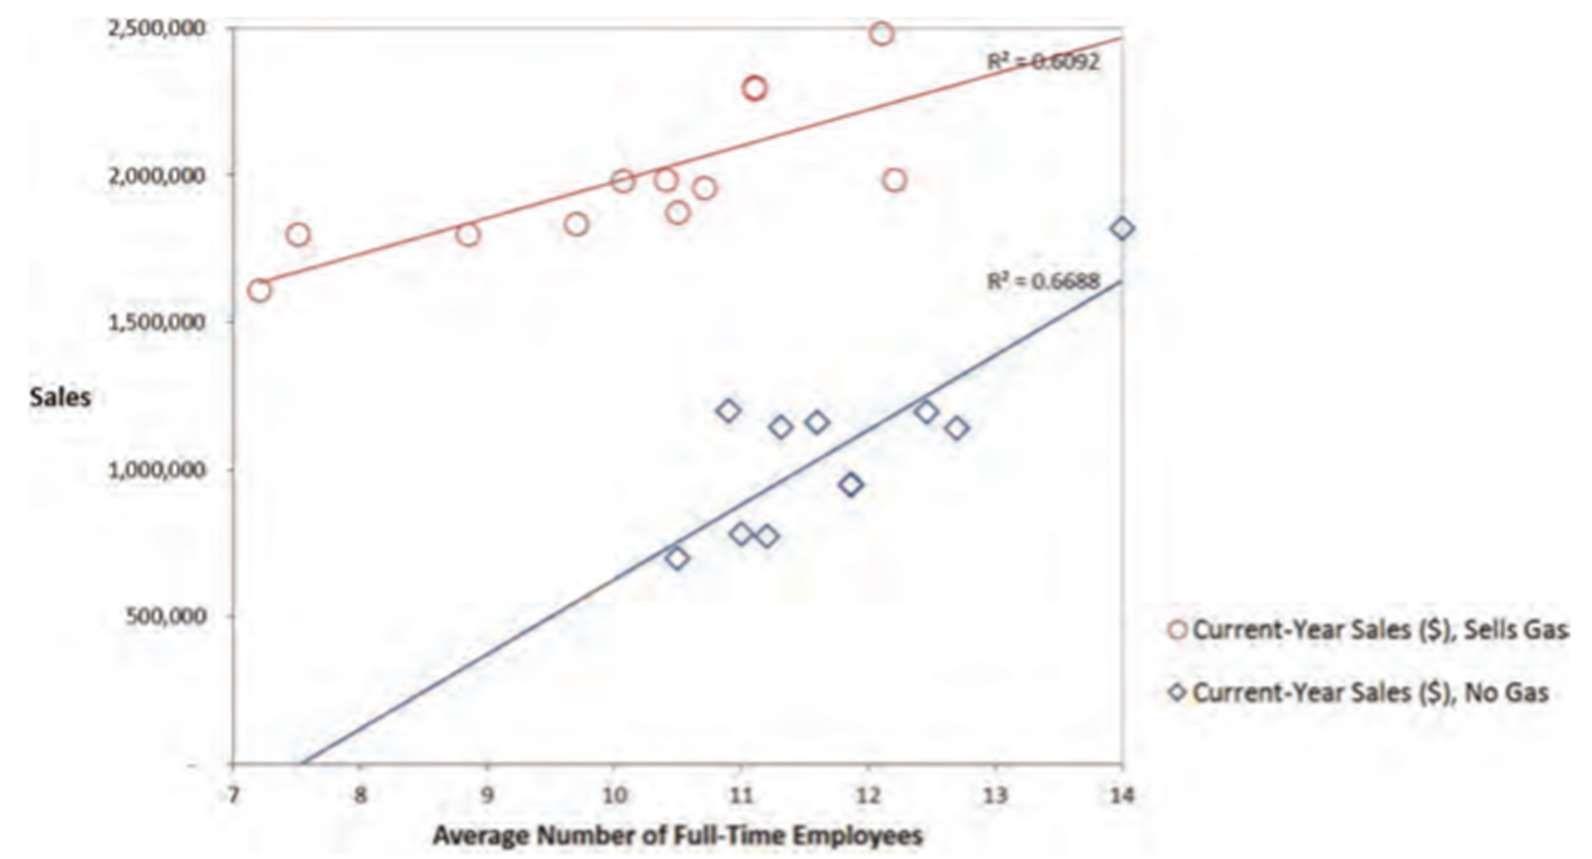
Figure 5: Quicky Stores, Scatterplot of Sales versus Average Number of Employees
Correlation between Sales and Number of Employees
Sales 2500000 2000000 1500000 1000000 500000 O O O O O. 1 2 3 4 5 6 7 8 9 10 11 12 O O. Store ID O 13 14 15 16 17 18 19 20 21 22 23 O Current-Year Sales ($) Prior-Year Sales (Audited) ($)
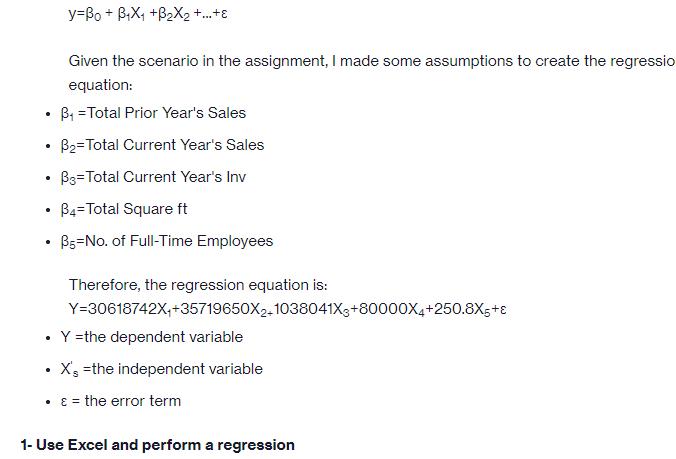
Step by Step Solution
3.40 Rating (159 Votes )
There are 3 Steps involved in it
To analyze the difference in revenue among the stores we need to consider various factors that might contribute to the variations Based on the provide... View full answer

Get step-by-step solutions from verified subject matter experts