

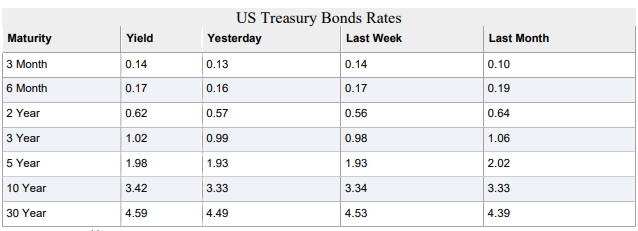
Question: Data for yield Curve (Table 1) 26 Jan 2010 Data Questions: 1. Plot the yield curve from the data in the table above. Describe the
Data for yield Curve (Table 1) 26 Jan 2010 Data
Questions:
1. Plot the yield curve from the data in the table above. Describe the yield curve and what the yield curve might suggest about the existing financial climate.
2. Discuss the other two yield curve types and what they suggest for the economy.
Yield Last Month Maturity 3 Month 6 Month 2 Year 0.14 US Treasury Bonds Rates Yesterday Last Week 0.13 0.14 0.16 0.17 0.10 0.19 0.17 0.62 0.57 0.56 0.64 3 Year 1.02 0.99 0.98 1.06 5 Year 1.98 1.93 1.93 2.02 10 Year 3.42 3.33 3.34 3.33 30 Year 4.59 4.49 4.53 4.39
Step by Step Solution
There are 3 Steps involved in it
1 Expert Approved Answer
Step: 1 Unlock

Question Has Been Solved by an Expert!
Get step-by-step solutions from verified subject matter experts
Step: 2 Unlock
Step: 3 Unlock