

Question: Data has been inserted on the sheets apple WWW WWW Name juice Mass of empty beaker (grams) 4.600 14.808 Mass of beaker + solution (grams)
Data has been inserted on the sheets
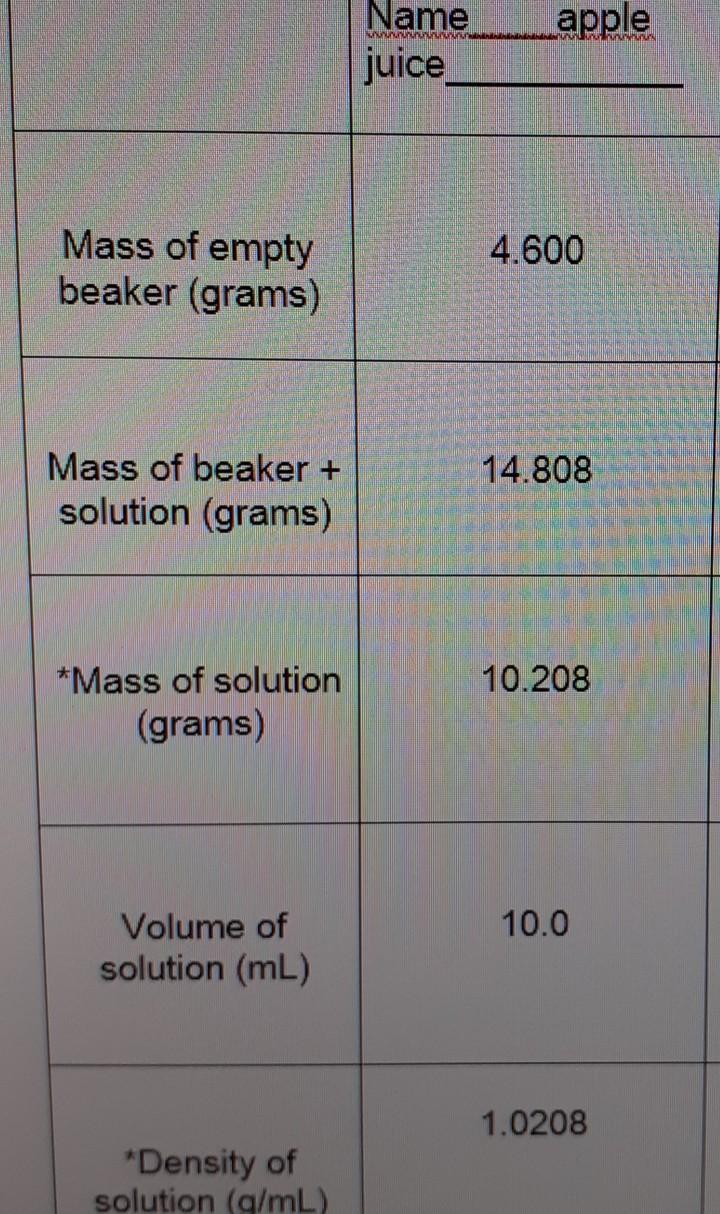
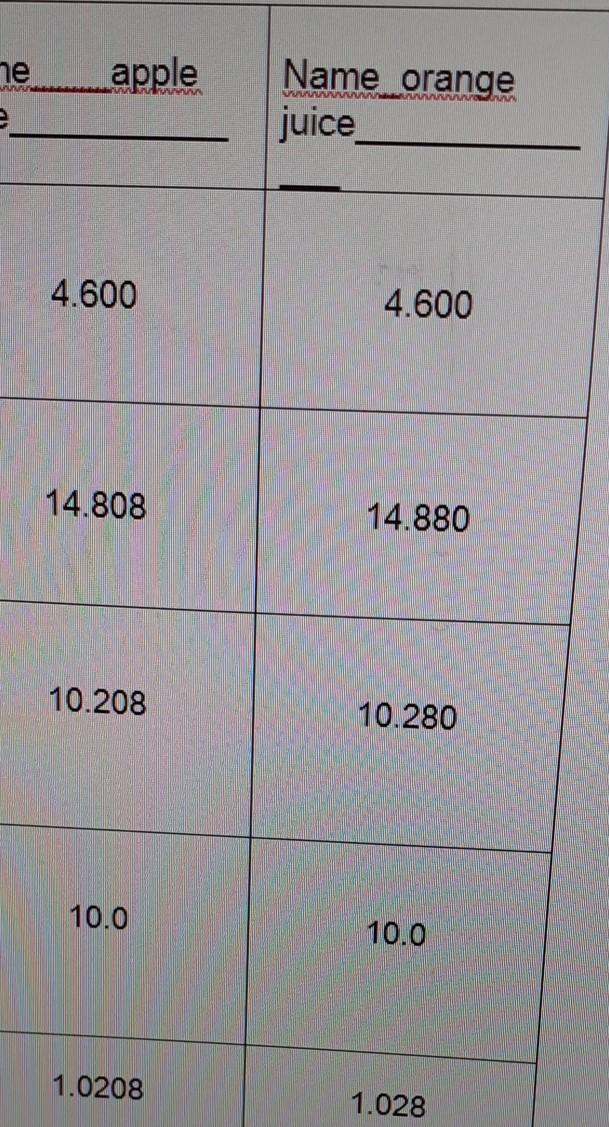
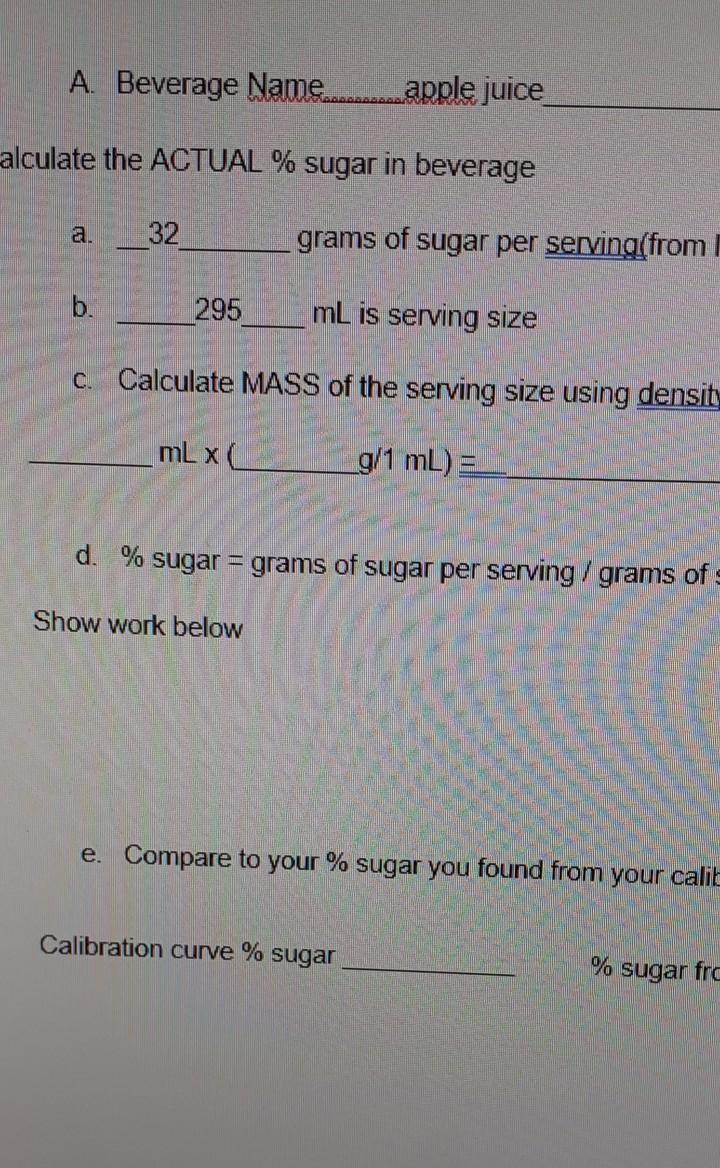
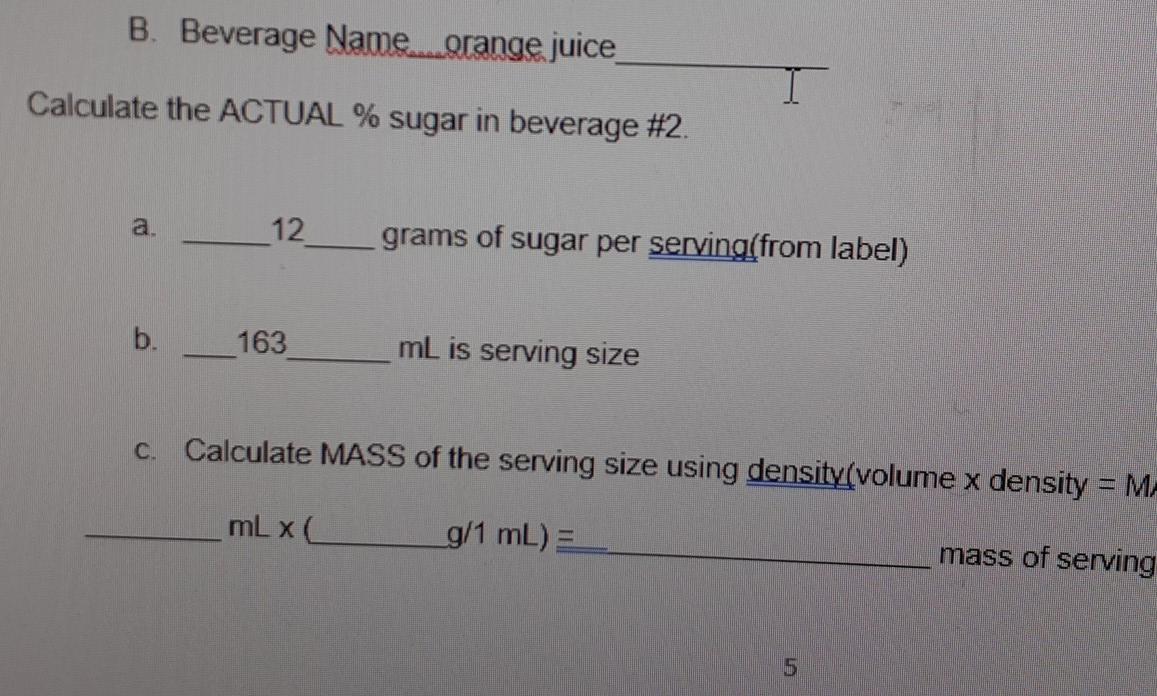
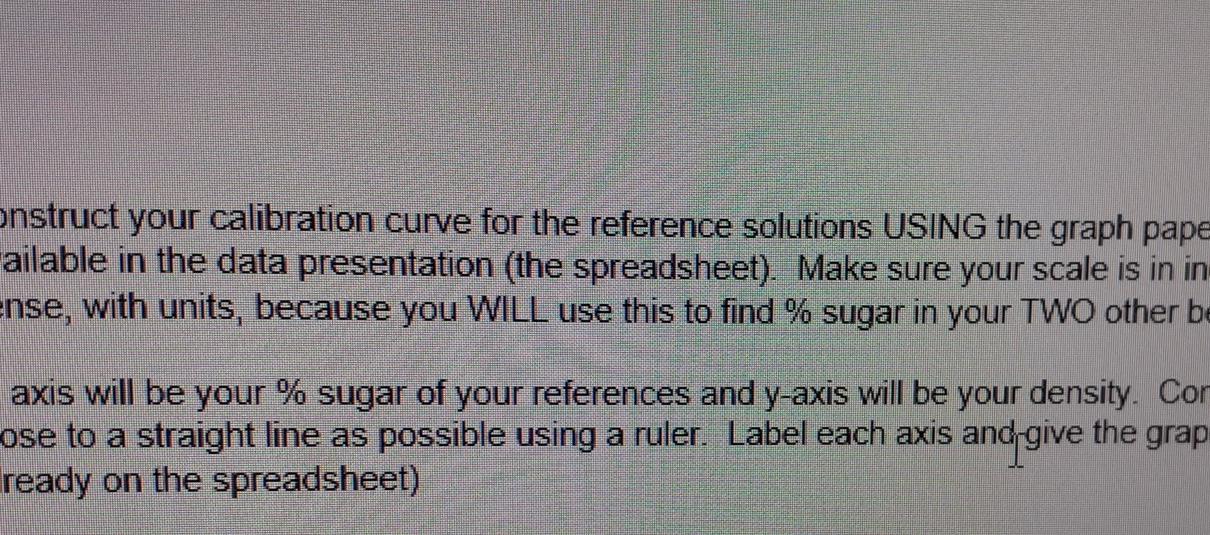
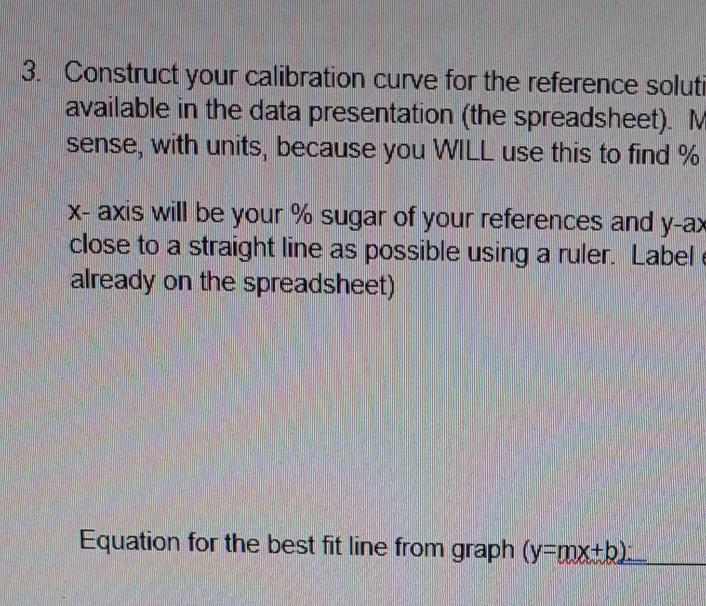
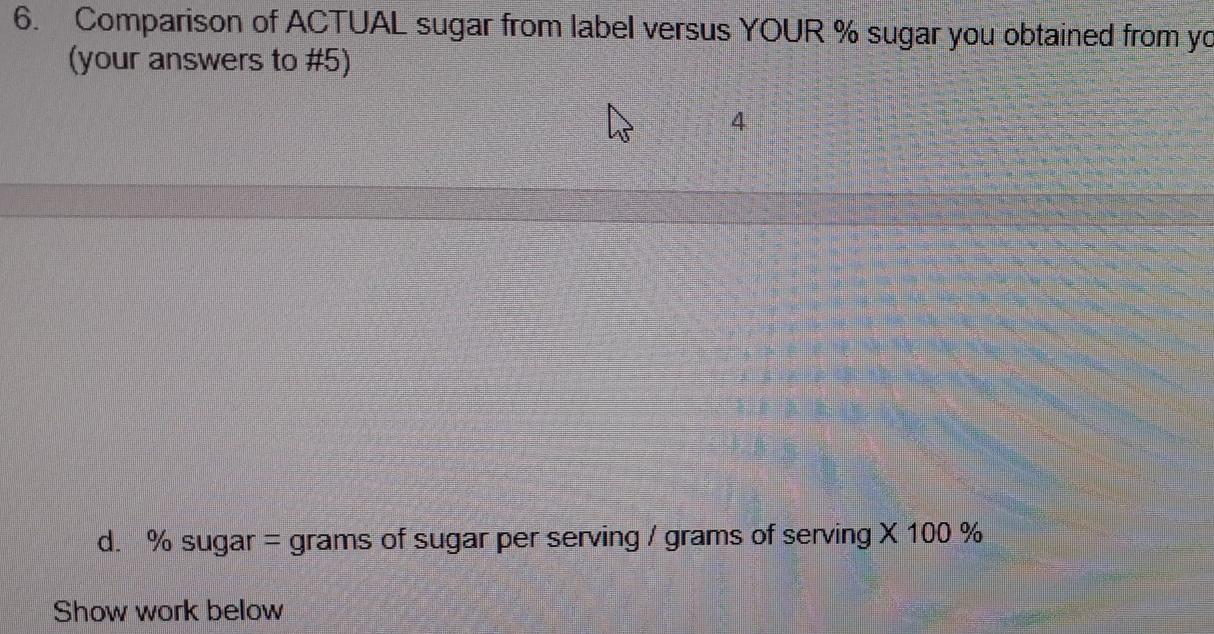
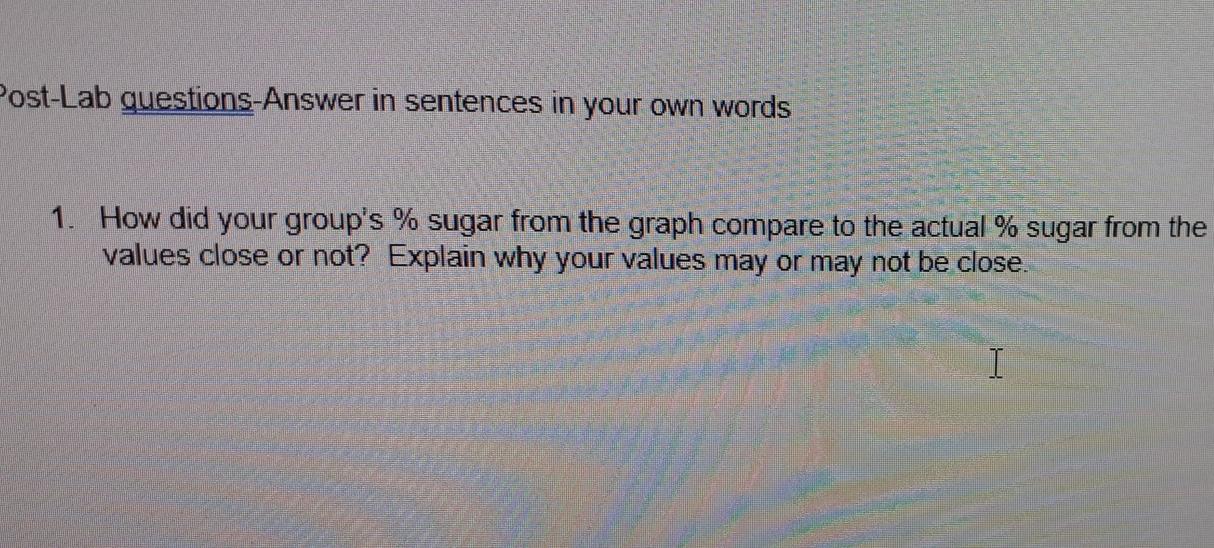
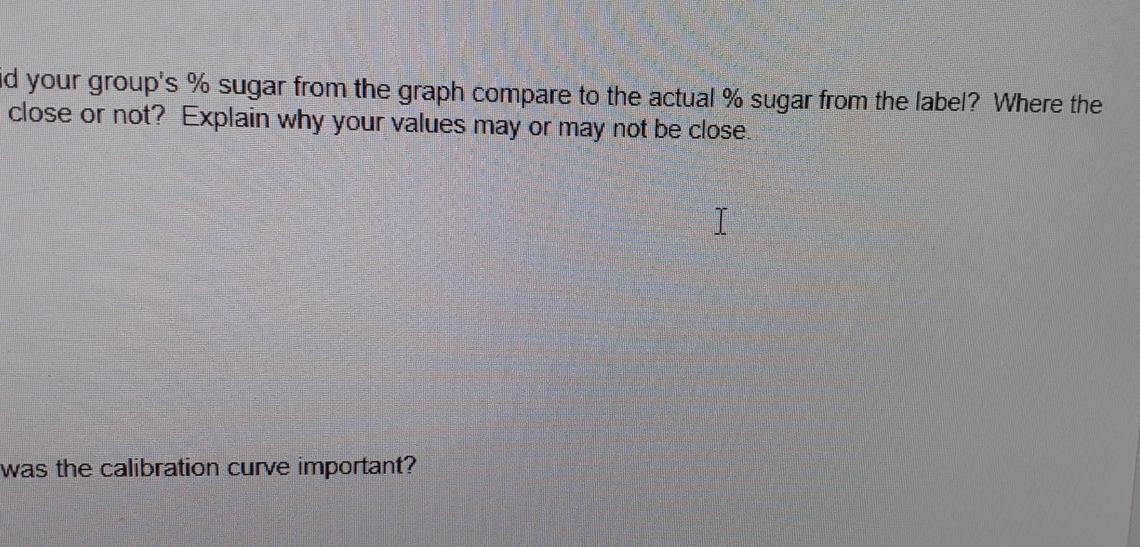
apple WWW WWW Name juice Mass of empty beaker (grams) 4.600 14.808 Mass of beaker + solution (grams) 10.208 *Mass of solution (grams) 10.0 Volume of solution (mL) 1.0208 *Density of solution (g/mL) apple Name orange WWW ne e WANNOWN juice 4.600 4.600 14.808 14.880 10.208 10.280 10.0 10.0 1.0208 1.028 A Beverage Name apple juice alculate the ACTUAL % sugar in beverage a. 32 grams of sugar per serving(from b. 295 mL is serving size C. Calculate MASS of the serving size using density mLx _g/1 mL) = d. % sugar = grams of sugar per serving / grams of Show work below e. Compare to your % sugar you found from your calit Calibration curve % sugar % sugar frc B. Beverage Name...orange juice Calculate the ACTUAL % sugar in beverage #2. I a. 12 grams of sugar per serving(from label) b. 163 mL is serving size C. Calculate MASS of the serving size using density(volume x density = M- mLx g/1 mL) = mass of serving 5 onstruct your calibration curve for the reference solutions USING the graph pape ailable in the data presentation (the spreadsheet). Make sure your scale is in in Ense, with units, because you WILL use this to find % sugar in your TWO other be axis will be your % sugar of your references and y-axis will be your density. Cor ose to a straight line as possible using a ruler. Label each axis and give the grap ready on the spreadsheet) 3. Construct your calibration curve for the reference soluti available in the data presentation (the spreadsheet). M sense, with units, because you WILL use this to find % X-axis will be your % sugar of your references and y-ax close to a straight line as possible using a ruler. Labele already on the spreadsheet) Equation for the best fit line from graph (y=mx+b). 5. Using your two calculated densities and your calibration curve (graph), find the drinks. Beverage Name Apple Juice % sugar from calibration curve Beverage Name _Orange juice % sugar from calibration curve your two calculated densities and your calibration curve (graph), find the % sugar in each of your I ne Apple Juice % sugar from calibration curve ame_Orange juice % sugar om calibration curve 6. Comparison of ACTUAL sugar from label versus YOUR % sugar you obtained from yo (your answers to #5) 4 d. % sugar = grams of sugar per serving / grams of serving X 100 % Show work below JAL sugar from label versus YOUR % sugar you obtained from your calibration curve 4 Post-Lab questions-Answer in sentences in your own words 1. How did your group's % sugar from the graph compare to the actual % sugar from the values close or not? Explain why your values may or may not be close. I id your group's % sugar from the graph compare to the actual % sugar from the label? Where the close or not? Explain why your values may or may not be close. I was the calibration curve important? 2. Why was the calibration curve important? tate one possible error in this lab and how the error could affect the outcomes and re apple WWW WWW Name juice Mass of empty beaker (grams) 4.600 14.808 Mass of beaker + solution (grams) 10.208 *Mass of solution (grams) 10.0 Volume of solution (mL) 1.0208 *Density of solution (g/mL) apple Name orange WWW ne e WANNOWN juice 4.600 4.600 14.808 14.880 10.208 10.280 10.0 10.0 1.0208 1.028 A Beverage Name apple juice alculate the ACTUAL % sugar in beverage a. 32 grams of sugar per serving(from b. 295 mL is serving size C. Calculate MASS of the serving size using density mLx _g/1 mL) = d. % sugar = grams of sugar per serving / grams of Show work below e. Compare to your % sugar you found from your calit Calibration curve % sugar % sugar frc B. Beverage Name...orange juice Calculate the ACTUAL % sugar in beverage #2. I a. 12 grams of sugar per serving(from label) b. 163 mL is serving size C. Calculate MASS of the serving size using density(volume x density = M- mLx g/1 mL) = mass of serving 5 onstruct your calibration curve for the reference solutions USING the graph pape ailable in the data presentation (the spreadsheet). Make sure your scale is in in Ense, with units, because you WILL use this to find % sugar in your TWO other be axis will be your % sugar of your references and y-axis will be your density. Cor ose to a straight line as possible using a ruler. Label each axis and give the grap ready on the spreadsheet) 3. Construct your calibration curve for the reference soluti available in the data presentation (the spreadsheet). M sense, with units, because you WILL use this to find % X-axis will be your % sugar of your references and y-ax close to a straight line as possible using a ruler. Labele already on the spreadsheet) Equation for the best fit line from graph (y=mx+b). 5. Using your two calculated densities and your calibration curve (graph), find the drinks. Beverage Name Apple Juice % sugar from calibration curve Beverage Name _Orange juice % sugar from calibration curve your two calculated densities and your calibration curve (graph), find the % sugar in each of your I ne Apple Juice % sugar from calibration curve ame_Orange juice % sugar om calibration curve 6. Comparison of ACTUAL sugar from label versus YOUR % sugar you obtained from yo (your answers to #5) 4 d. % sugar = grams of sugar per serving / grams of serving X 100 % Show work below JAL sugar from label versus YOUR % sugar you obtained from your calibration curve 4 Post-Lab questions-Answer in sentences in your own words 1. How did your group's % sugar from the graph compare to the actual % sugar from the values close or not? Explain why your values may or may not be close. I id your group's % sugar from the graph compare to the actual % sugar from the label? Where the close or not? Explain why your values may or may not be close. I was the calibration curve important? 2. Why was the calibration curve important? tate one possible error in this lab and how the error could affect the outcomes and re
Step by Step Solution
There are 3 Steps involved in it

Get step-by-step solutions from verified subject matter experts