

Question: DATA MANAGEMENT FREQUENCY DISTRIBUTION 9. Tally marks are often used to make a frequency distribution table. You survey a number of households and find out
DATA MANAGEMENT FREQUENCY DISTRIBUTION 9. Tally marks are often used to make a frequency distribution table. You survey a number of households and find out how many pets they own.
The results are 3, 0, 1, 4, 4, 1, 2, 0, 2, 2, 0, 2, 0, 1, 3, 1, 2, 1, 1, 3.
Construct a grouped frequency distribution for the data.
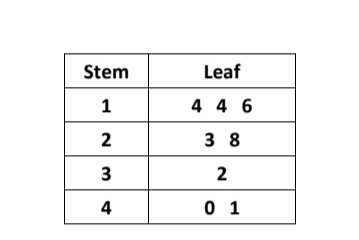
STEM AND LEAF PLOT 10. Given below is the stem and leaf plot of the people who attended an election campaign from various places. Jim is trying to read the plot, but he has many doubts. Can you clarify them?
(a) What are the data values of stem 2? (b) How many values are less than 16?
Step by Step Solution
There are 3 Steps involved in it
1 Expert Approved Answer
Step: 1 Unlock

Question Has Been Solved by an Expert!
Get step-by-step solutions from verified subject matter experts
Step: 2 Unlock
Step: 3 Unlock