

Question: Data Management / Statistics and Probability 9. The cumulative frequency of the 3rd bin in a frequency distribution table represents: the cumulative deviation of the
Data Management / Statistics and Probability
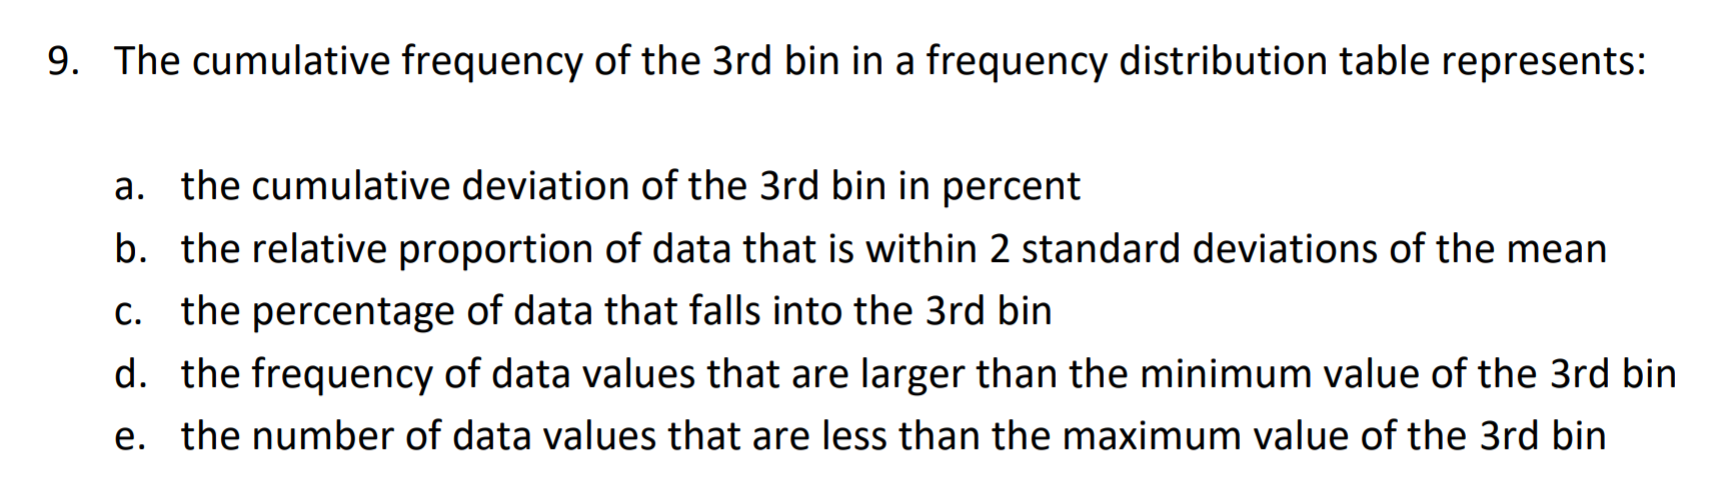
9. The cumulative frequency of the 3rd bin in a frequency distribution table represents: the cumulative deviation of the 3rd bin in percent . the relative proportion of data that is within 2 standard deviations of the mean the percentage of data that falls into the 3rd bin the frequency of data values that are larger than the minimum value of the 3rd bin the number of data values that are less than the maximum value of the 3rd bin romeo-9
Step by Step Solution
There are 3 Steps involved in it
1 Expert Approved Answer
Step: 1 Unlock

Question Has Been Solved by an Expert!
Get step-by-step solutions from verified subject matter experts
Step: 2 Unlock
Step: 3 Unlock