

Question: Data Pennies dated before 1981 #1: 1963 #2: 1979 #3: 1973 #4: 1976 Mass (g) #1: 3.089 #2: 3.077 #3: 3.063 #4: 3.086 ---------------------------- Pennies
Data 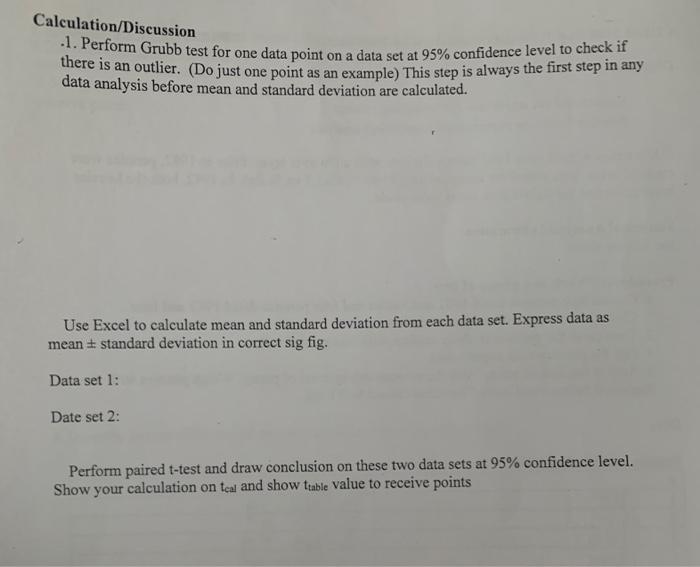
Pennies dated before 1981
#1: 1963
#2: 1979
#3: 1973
#4: 1976
Mass (g)
#1: 3.089
#2: 3.077
#3: 3.063
#4: 3.086
----------------------------
Pennies dated after 1983
#1: 1983
#2: 1997
#3: 2001
#4: 2000
Mass (g)
#1: 2.500
#2: 2.505
#3: 2.480
#4: 2.518
Calculation/Discussion 1. Perform Grubb test for one data point on a data set at 95% confidence level to check if there is an outlier. (Do just one point as an example. This step is always the first step in any data analysis before mean and standard deviation are calculated. Use Excel to calculate mean and standard deviation from each data set. Express data as mean standard deviation in correct sig fig. Data set 1: Date set 2: Perform paired t-test and draw conclusion on these two data sets at 95% confidence level. Show your calculation on teal and show table value to receive points
Step by Step Solution
There are 3 Steps involved in it
1 Expert Approved Answer
Step: 1 Unlock

Question Has Been Solved by an Expert!
Get step-by-step solutions from verified subject matter experts
Step: 2 Unlock
Step: 3 Unlock