

Question: Data Sheet for lonization Constant of a Weak Acid Name: Molarity of acid IM Molarity of NaOH 0.5M 1 40.00 2 40.00 3 40.00 4
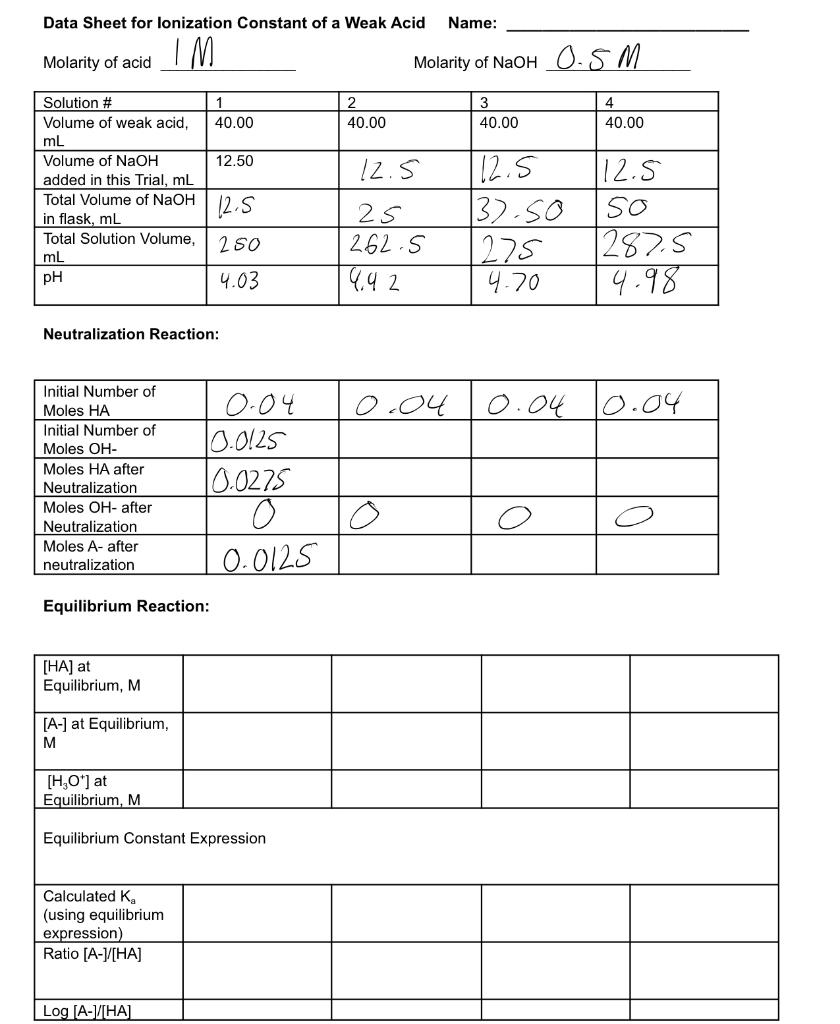
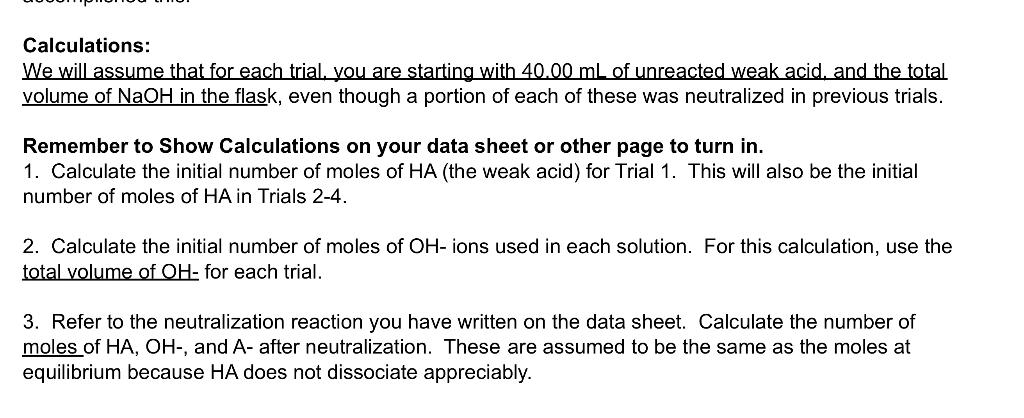
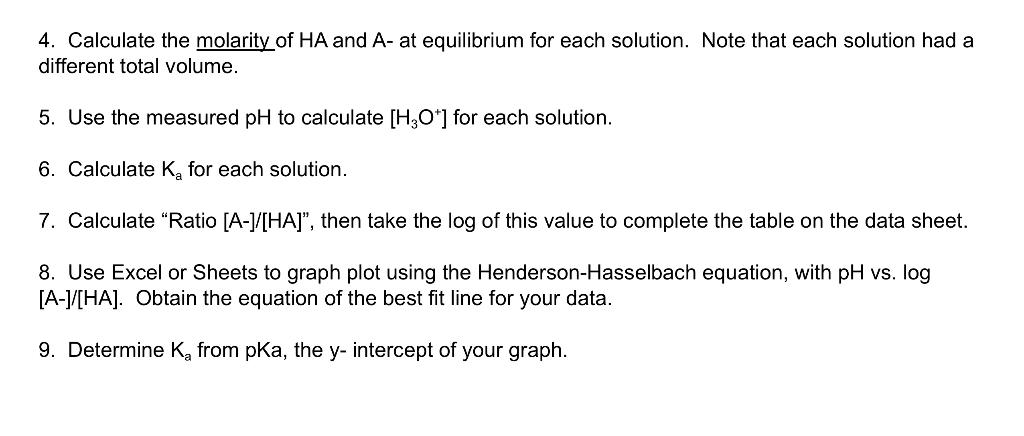
Data Sheet for lonization Constant of a Weak Acid Name: Molarity of acid IM Molarity of NaOH 0.5M 1 40.00 2 40.00 3 40.00 4 40.00 12.50 Solution # Volume of weak acid, mL Volume of NaOH added in this Trial, mL Total Volume of NaOH in flask, mL Total Solution Volume, mL pH 12.5 12.5 25 262.5 112.5 13.so 1275 4.70 12.5 so 1287.5 250 4.03 1942 4.98 Neutralization Reaction: 0.04 0.04 10.04 Initial Number of Moles HA Initial Number of Moles OH- Moles HA after Neutralization Moles OH-after Neutralization Moles A-after neutralization 0.04 0.0125 10.0275 0 0.0125 O Equilibrium Reaction: [HA) at Equilibrium, M [A-] at Equilibrium, M [H,O) at Equilibrium, M Equilibrium Constant Expression Calculated K (using equilibrium expression) Ratio [A-CHA] Log (A-1HA Calculations: We will assume that for each trial, you are starting with 40.00 mL of unreacted weak acid, and the total volume of NaOH in the flask, even though a portion of each of these was neutralized in previous trials. Remember to Show Calculations on your data sheet or other page to turn in. 1. Calculate the initial number of moles of HA (the weak acid) for Trial 1. This will also be the initial number of moles of HA in Trials 2-4. 2. Calculate the initial number of moles of OH-ions used in each solution. For this calculation, use the total volume of OH- for each trial. 3. Refer to the neutralization reaction you have written on the data sheet. Calculate the number of moles of HA, OH-, and A-after neutralization. These are assumed to be the same as the moles at equilibrium because HA does not dissociate appreciably. 4. Calculate the molarity of HA and A- at equilibrium for each solution. Note that each solution had a different total volume. 5. Use the measured pH to calculate [H3O+] for each solution. 6. Calculate K for each solution. 7. Calculate "Ratio [A-]/[HA], then take the log of this value to complete the table on the data sheet. 8. Use Excel or Sheets to graph plot using the Henderson-Hasselbach equation, with pH vs. log [A-]/[HA]. Obtain the equation of the best fit line for your data. 9. Determine K from pKa, the y-intercept of your graph
Step by Step Solution
There are 3 Steps involved in it

Get step-by-step solutions from verified subject matter experts