

Question: Data Sheets: Part A & Part B: pHand Total Alkalinity pH: 7.79 Concentration HCl: 0.01031M Initial Volume (ml) Final Volume (mL) Total Volume (mL) Volume
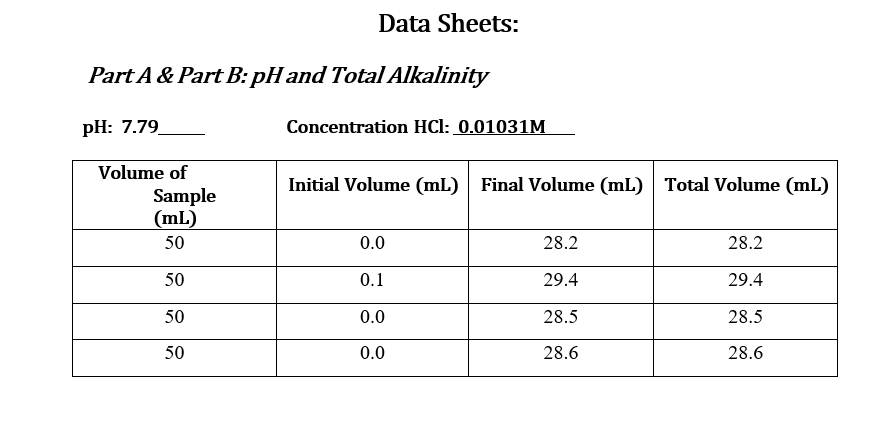
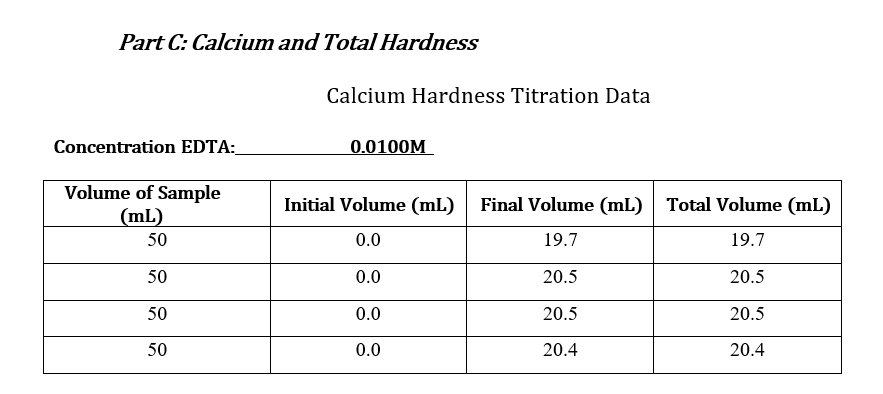
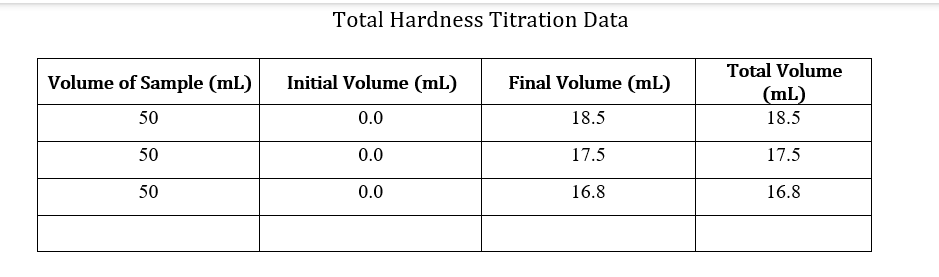
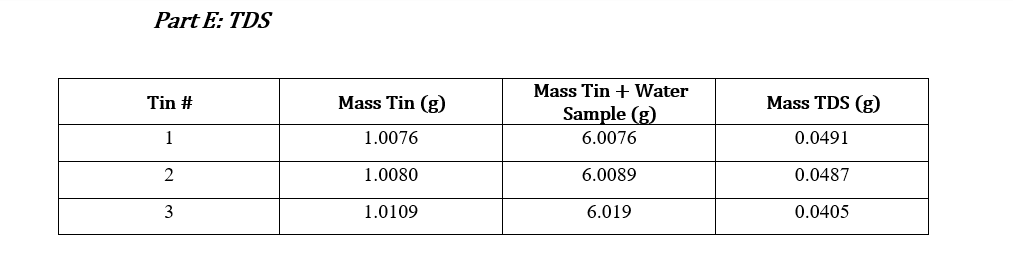
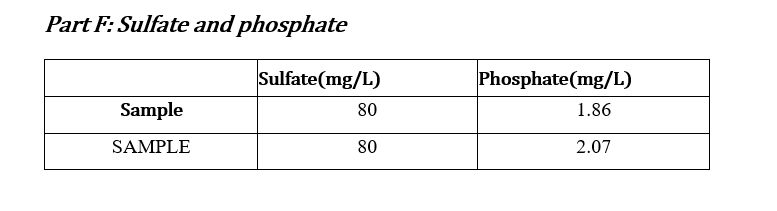
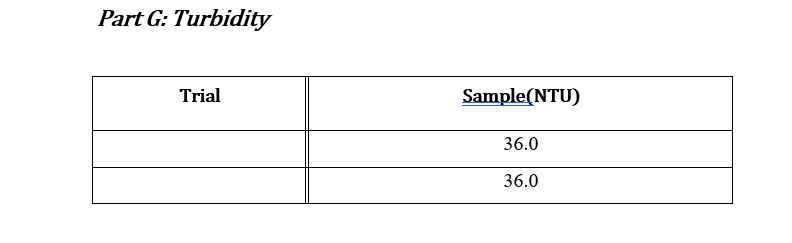
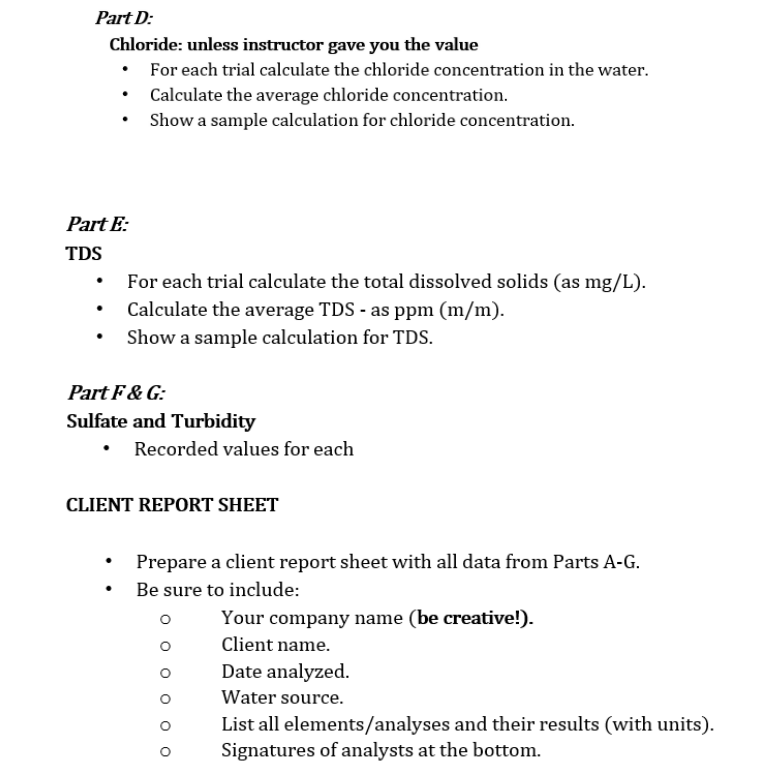
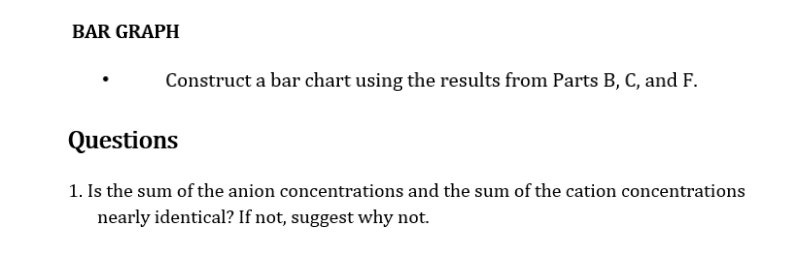
Data Sheets: Part A & Part B: pHand Total Alkalinity pH: 7.79 Concentration HCl: 0.01031M Initial Volume (ml) Final Volume (mL) Total Volume (mL) Volume of Sample (mL) 50 0.0 28.2 28.2 50 0.1 29.4 29.4 50 0.0 28.5 28.5 50 0.0 28.6 28.6 Part C: Calcium and Total Hardness Calcium Hardness Titration Data Concentration EDTA: 0.0100M Volume of Sample (mL) 50 Initial Volume (mL) Final Volume (mL) Total Volume (mL) 0.0 19.7 19.7 50 0.0 20.5 20.5 50 0.0 20.5 20.5 50 0.0 20.4 20.4 Total Hardness Titration Data Volume of Sample (mL) Initial Volume (mL) Final Volume (mL) Total Volume (mL) 18.5 50 0.0 18.5 50 0.0 17.5 17.5 50 0.0 16.8 16.8 Part E: TDS Tin # Mass Tin (g) Mass TDS (g) Mass Tin + Water Sample (8) 6.0076 1 1.0076 0.0491 2 1.0080 6.0089 0.0487 3 1.0109 6.019 0.0405 Part F: Sulfate and phosphate : Sulfate(mg/L) 80 Phosphate(mg/L) 1.86 Sample SAMPLE 80 2.07 Part G: Turbidity Trial Sample(NTU) 36.0 36.0 Part D: Chloride: unless instructor gave you the value For each trial calculate the chloride concentration in the water. Calculate the average chloride concentration. Show a sample calculation for chloride concentration. Part E: TDS For each trial calculate the total dissolved solids (as mg/L). Calculate the average TDS - as ppm (m/m). Show a sample calculation for TDS. . Part F&G: Sulfate and Turbidity Recorded values for each CLIENT REPORT SHEET Prepare a client report sheet with all data from Parts A-G. Be sure to include: Your company name (be creative!). Client name. Date analyzed. Water source. List all elements/analyses and their results (with units). Signatures of analysts at the bottom. BAR GRAPH Construct a bar chart using the results from Parts B, C, and F. Questions 1. Is the sum of the anion concentrations and the sum of the cation concentrations nearly identical? If not, suggest why not
Step by Step Solution
There are 3 Steps involved in it

Get step-by-step solutions from verified subject matter experts