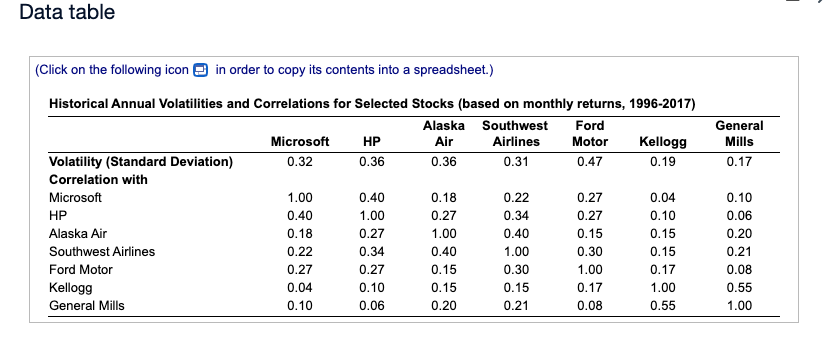
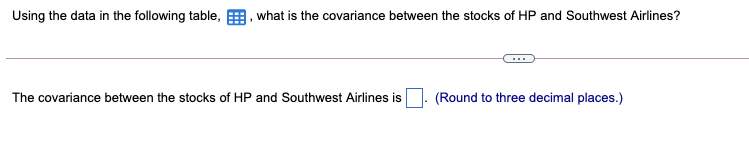
Question: Data table (Click on the following icon @) in order to copy its contents into a spreadsheet.) Historical Annual Volatilities and Correlations for Selected Stocks

Data table (Click on the following icon @) inData table (Click on the following icon @) in
Data table (Click on the following icon @) in order to copy its contents into a spreadsheet.) Historical Annual Volatilities and Correlations for Selected Stocks (based on monthly returns, 1996-2017) Alaska Southwest Ford General Microsoft HP Air Airlines Motor Kellogg Mills Volatility (Standard Deviation) 0.32 0.36 0.36 0.31 0.47 0.19 0.17 Correlation with Microsoft 1.00 0.40 0.18 0.22 0.27 0.04 0.10 HP 0.40 1.00 0.27 0.34 0.27 0.10 0.06 Alaska Air 0.18 0.27 1.00 0.40 0.15 0.15 0.20 Southwest Airlines 0.22 0.34 0.40 1.00 0.30 0.15 0.21 Ford Motor 0.27 0.27 0.15 0.30 1.00 0.17 0.08 Kellogg 0.04 0.10 0.15 0.15 0.17 1.00 0.55 General Mills 0.10 0.06 0.20 0.21 0.08 0.55 1.00Using the data in the following table, , what is the covariance between the stocks of HP and Southwest Airlines? The covariance between the stocks of HP and Southwest Airlines is (Round to three decimal places.)

Step by Step Solution

There are 3 Steps involved in it

1 Expert Approved Answer
Step: 1 Unlock blur-text-image
Question Has Been Solved by an Expert!

Get step-by-step solutions from verified subject matter experts

Step: 2 Unlock
Step: 3 Unlock

Students Have Also Explored These Related Finance Questions!