

Question: Data Table Men Full Data Set 5 Centimeters Centimeters Centimeters Centimeters (measured) (believed) (measured) (believed) A random sample of students at a college reported what
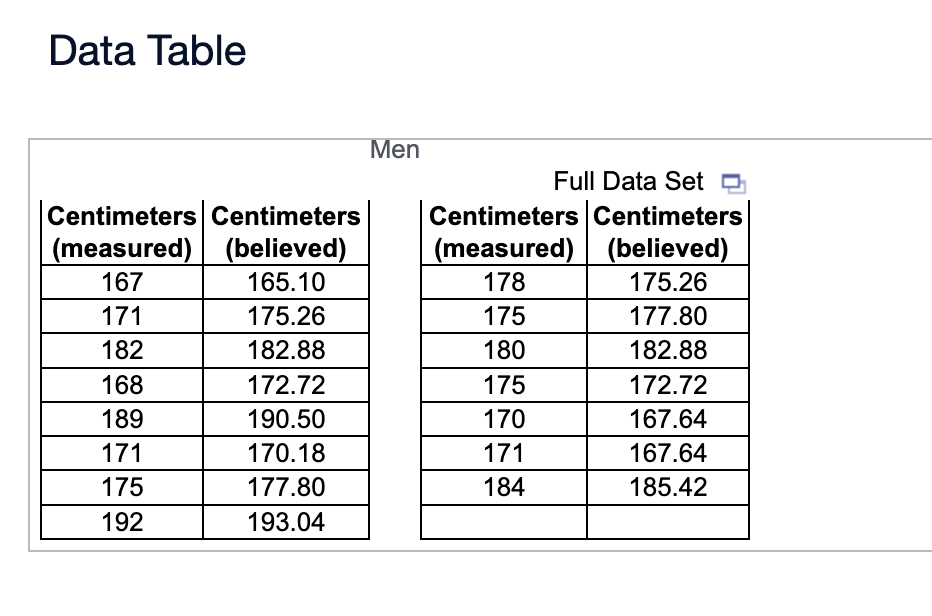
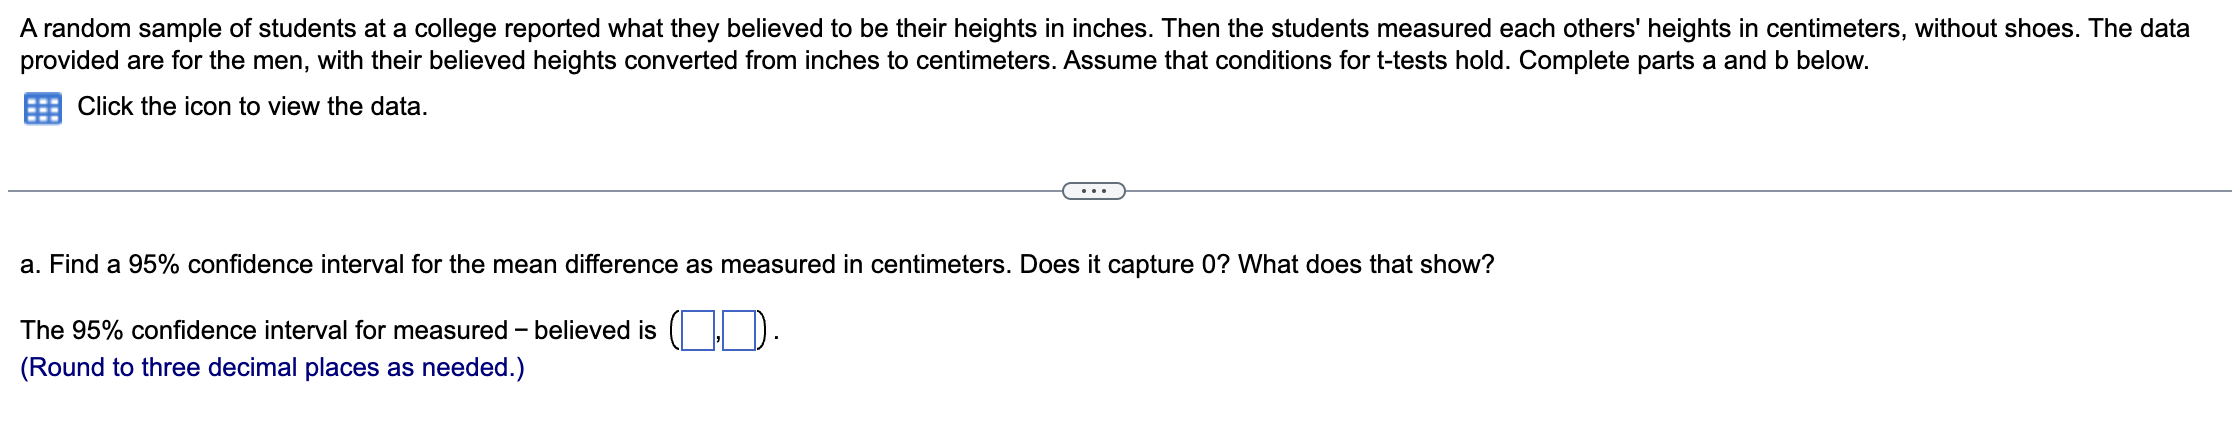
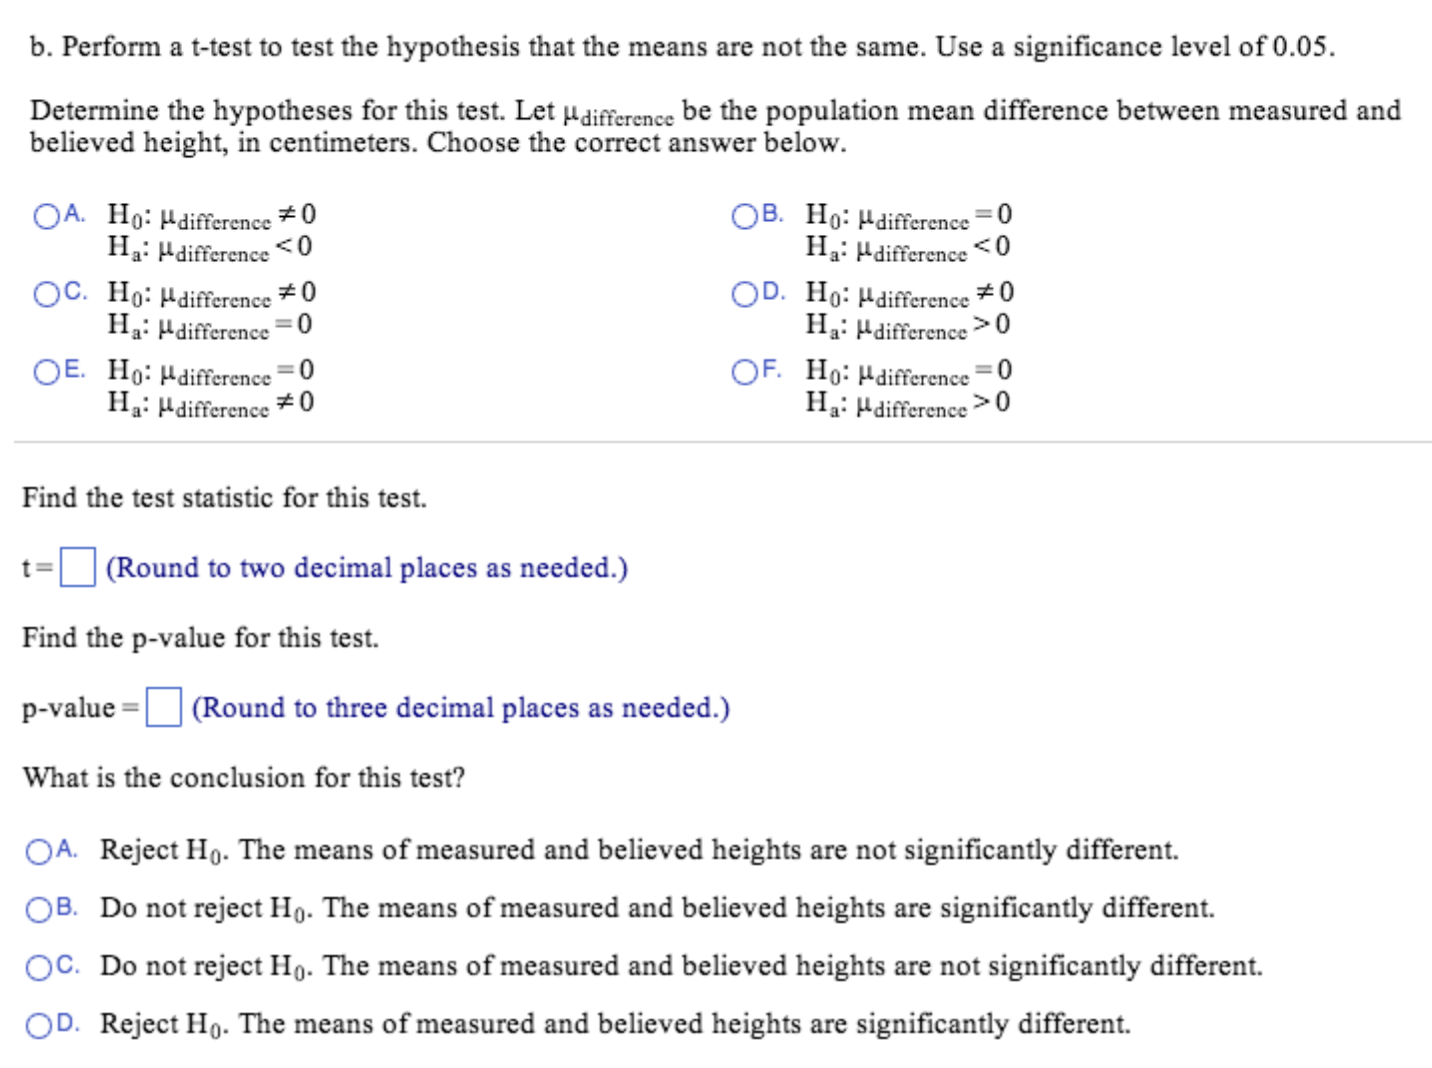
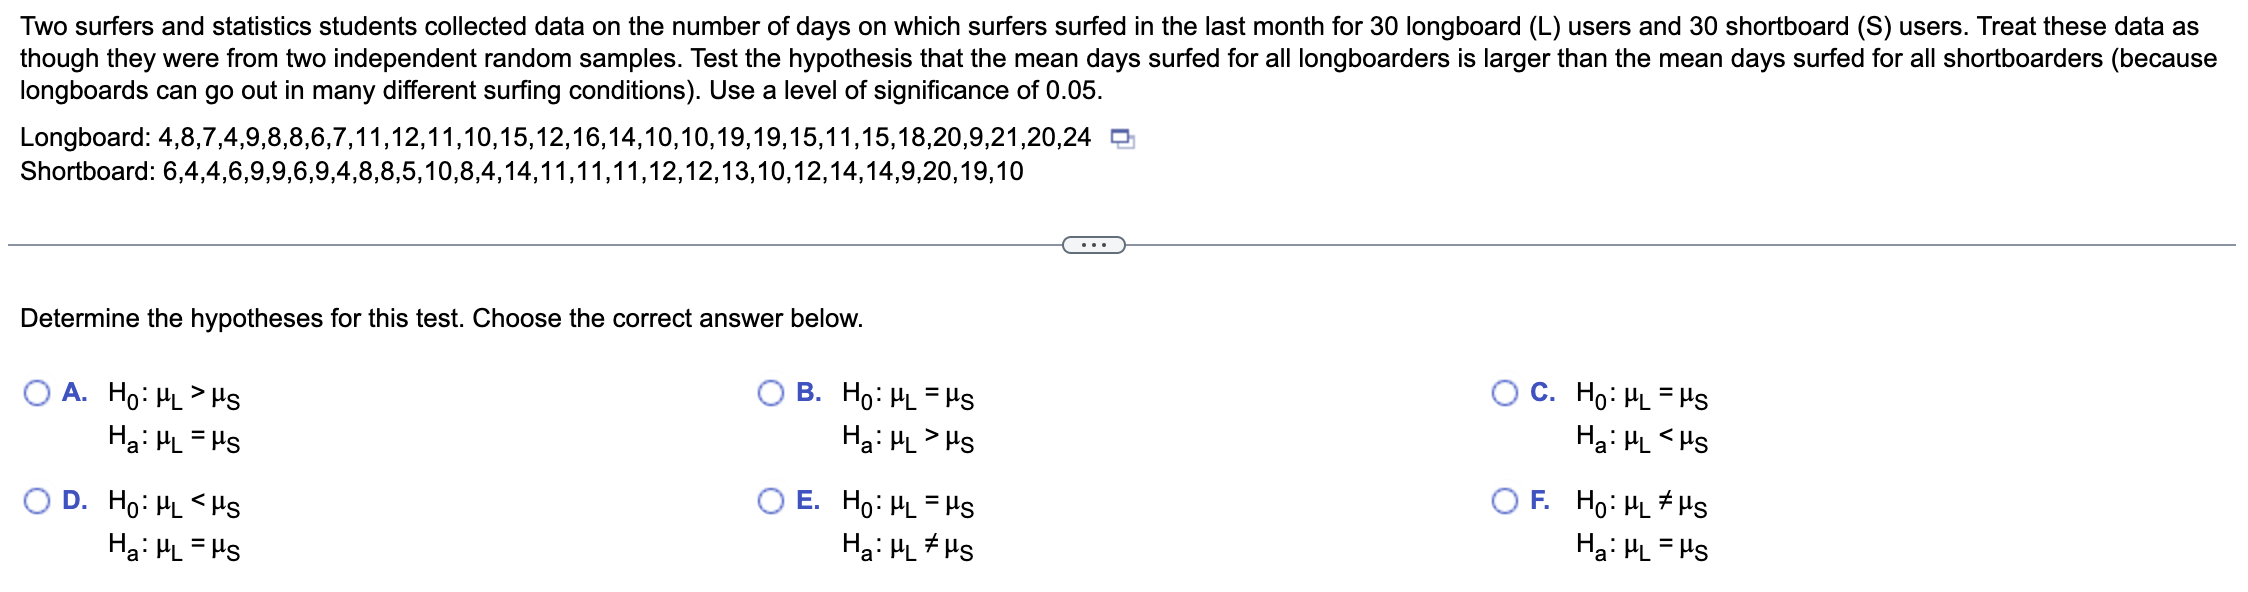
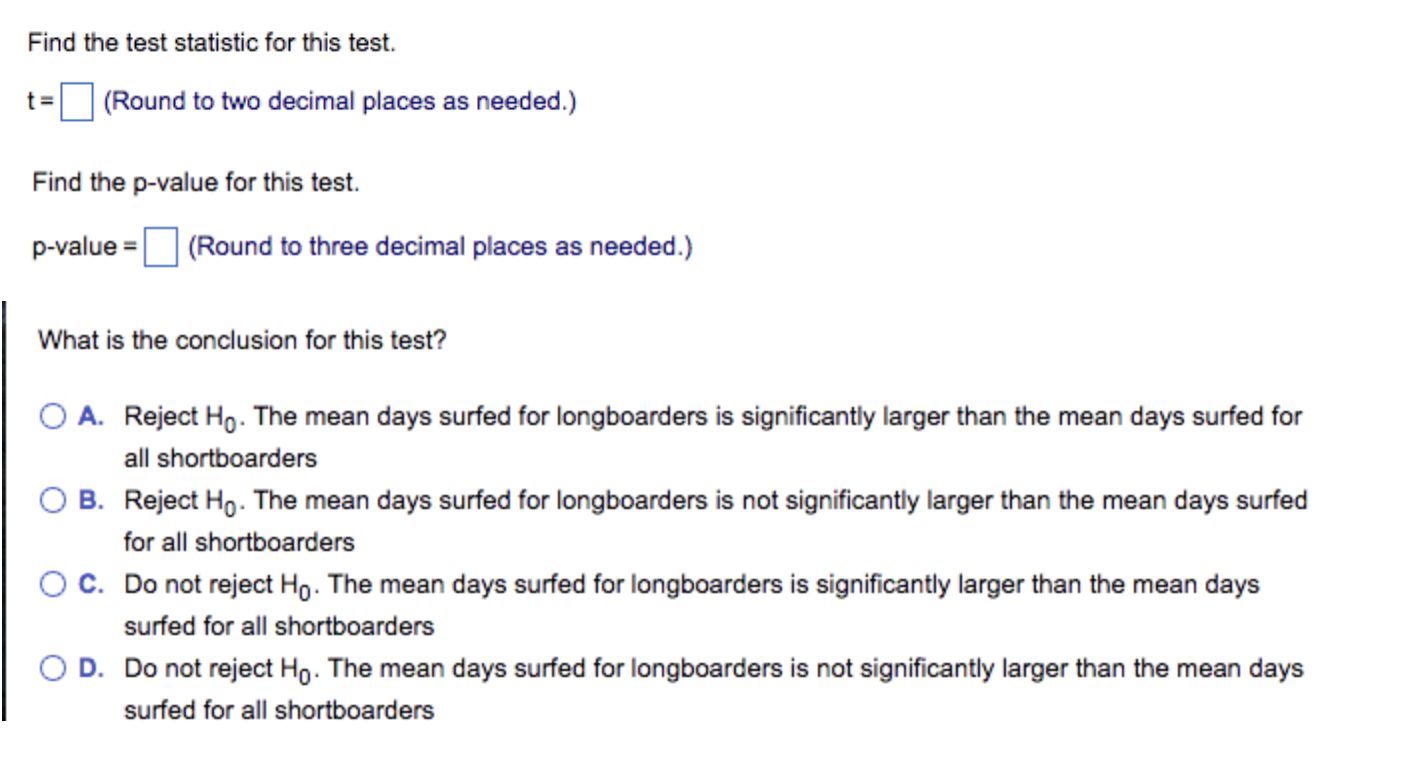
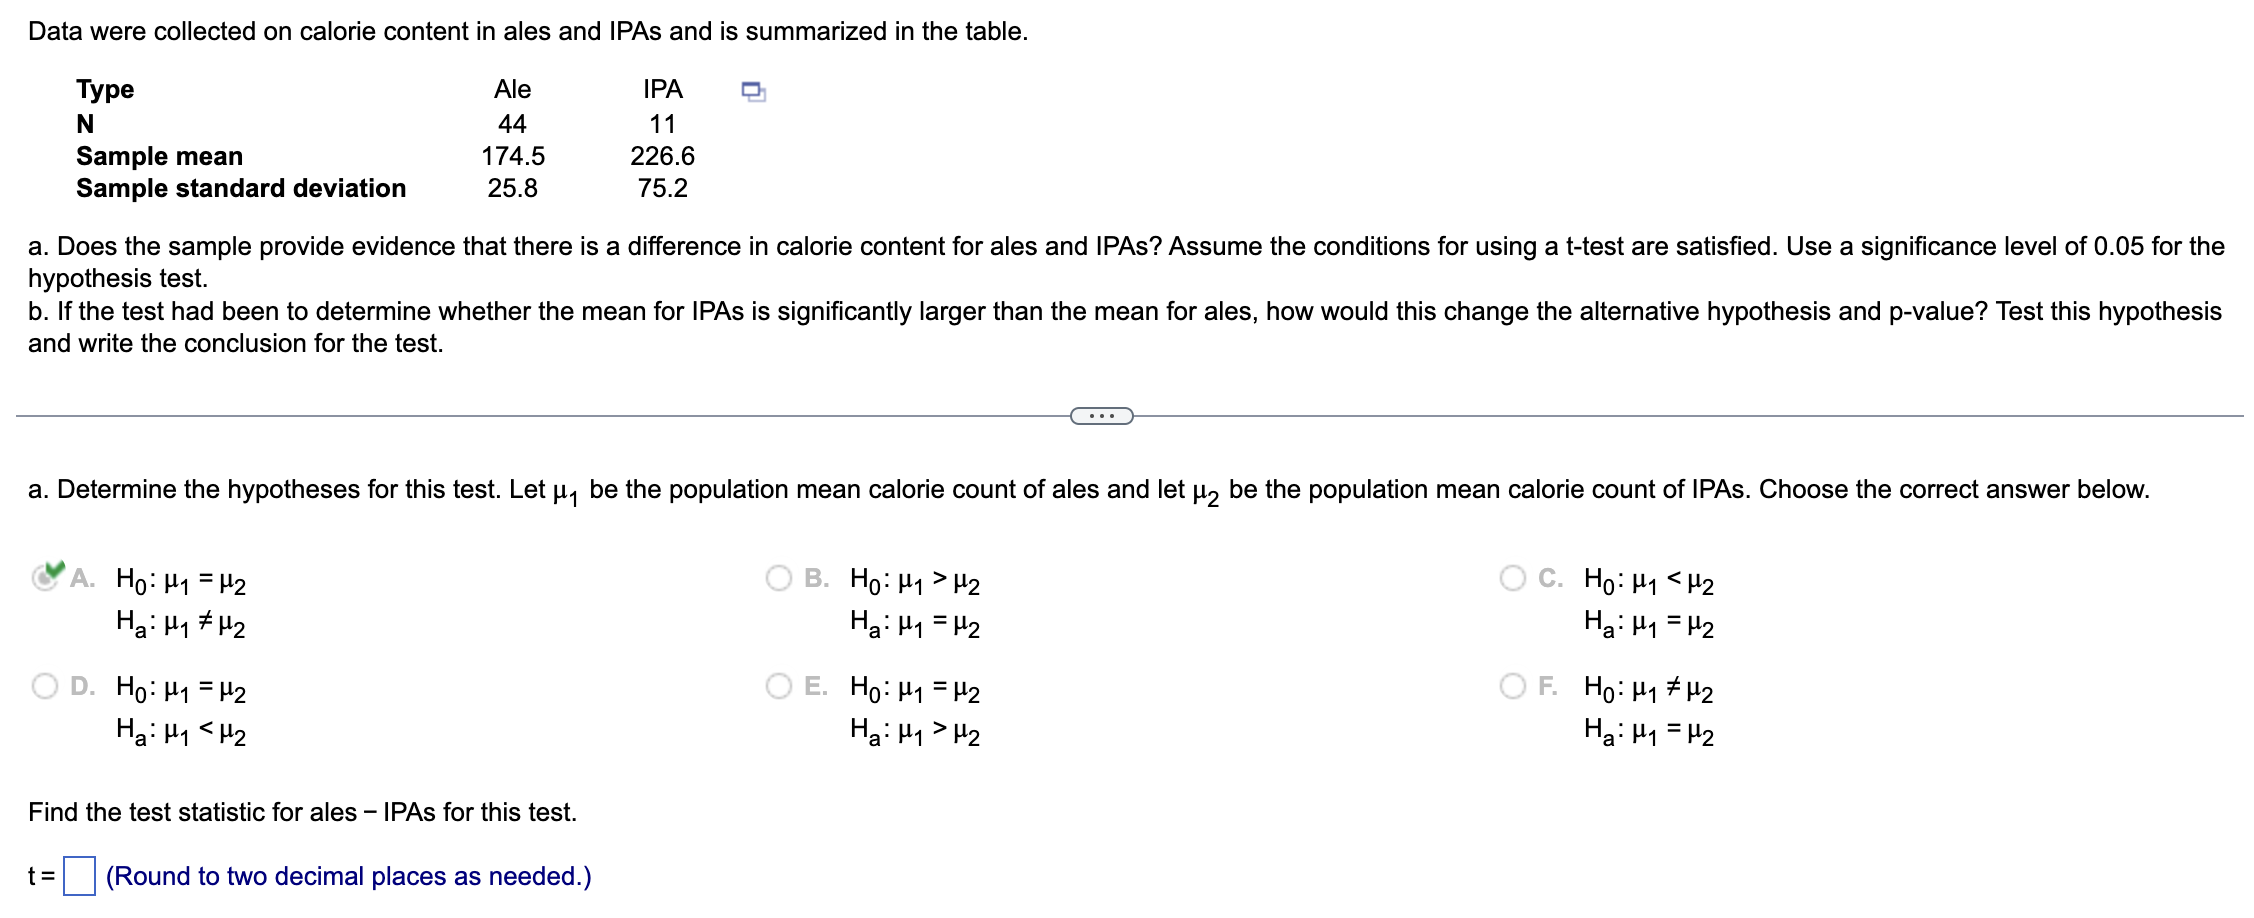
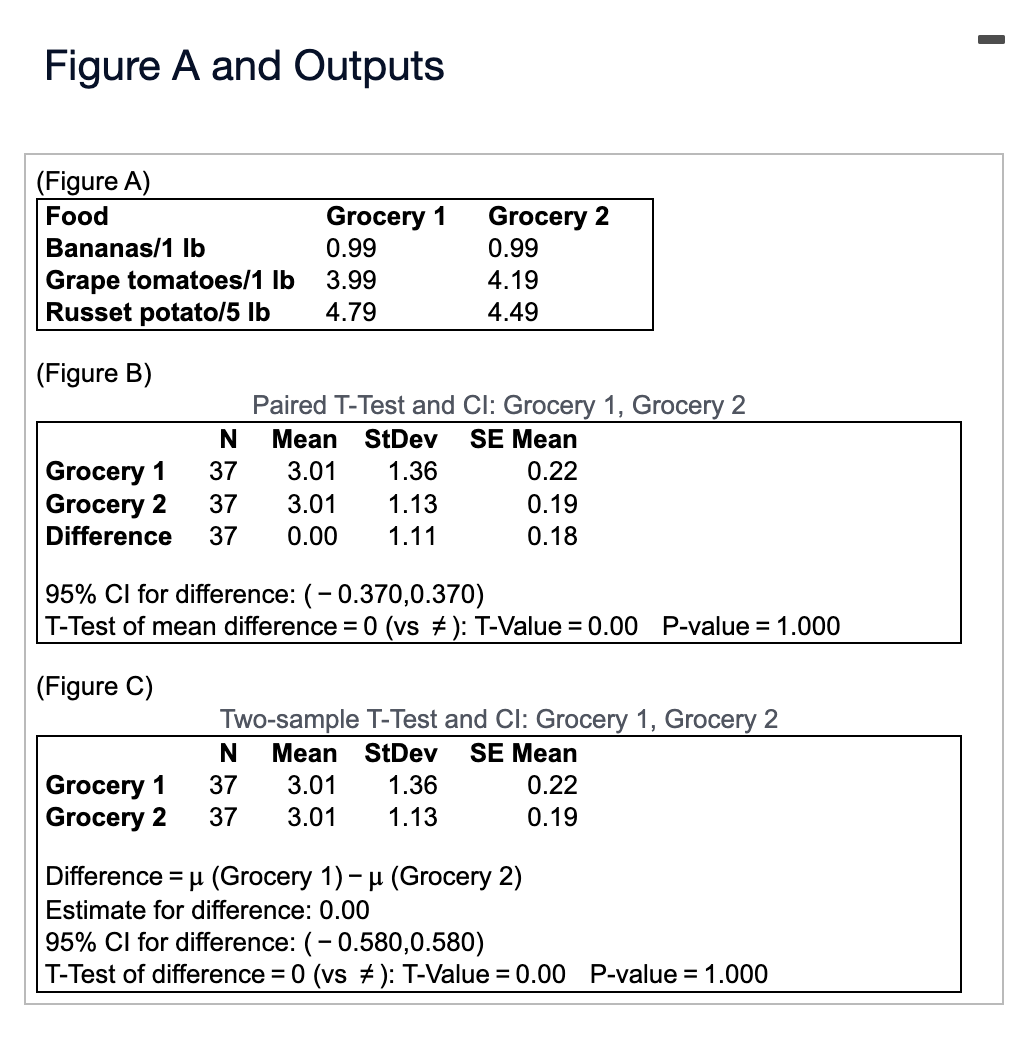
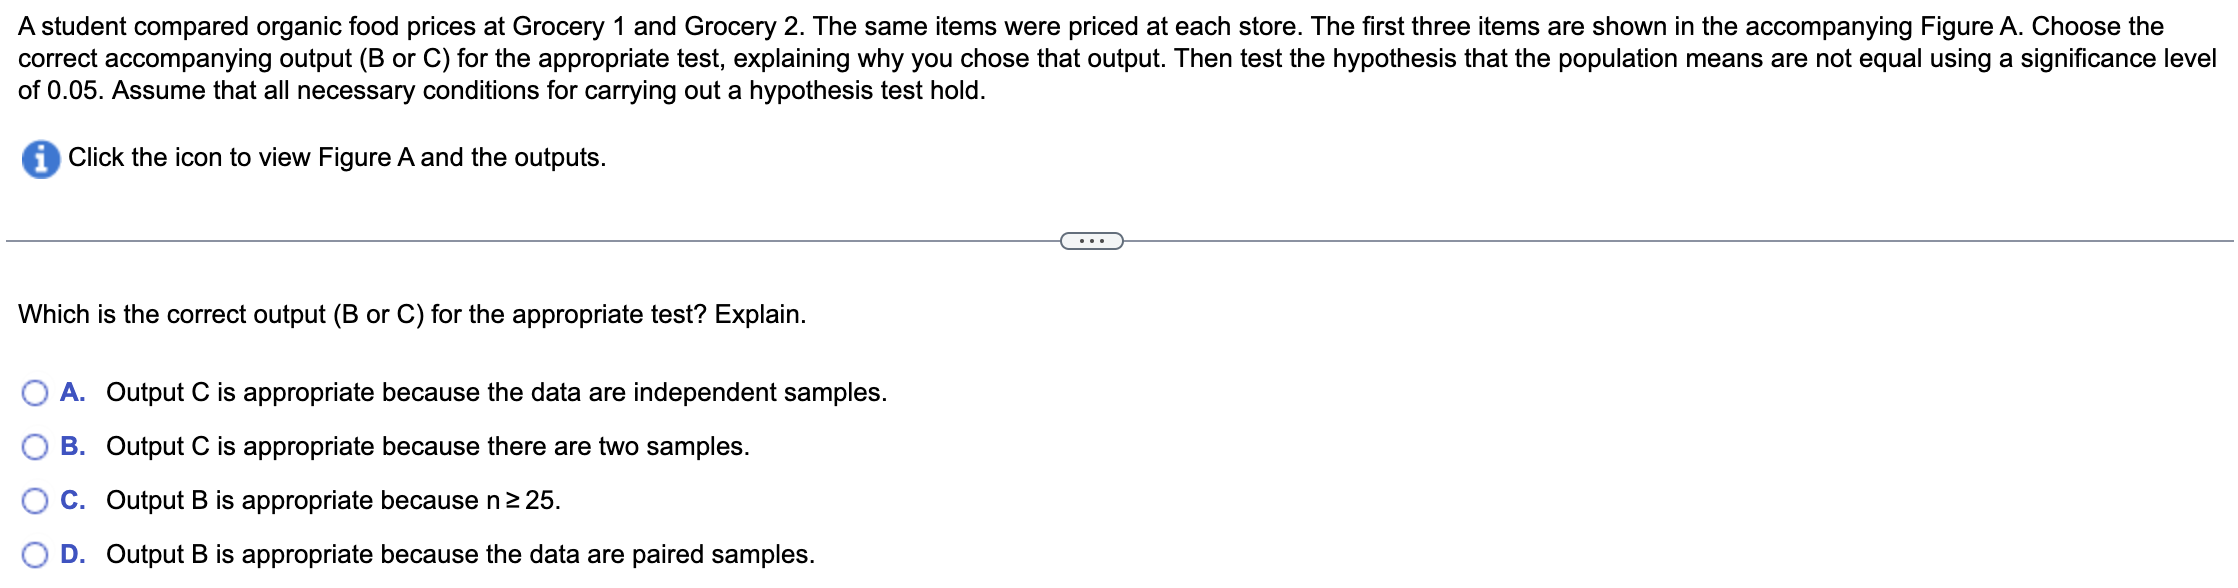
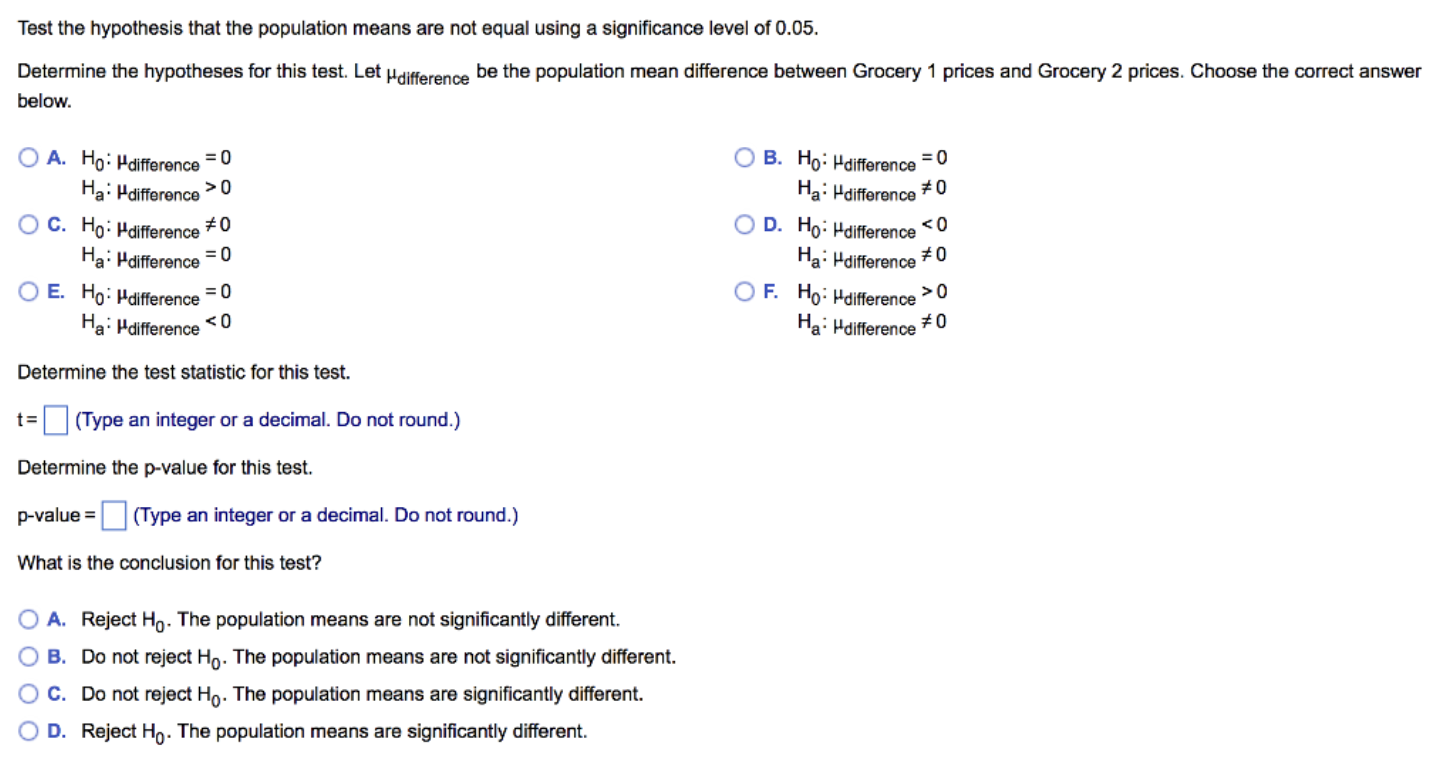
Data Table Men Full Data Set 5 Centimeters Centimeters Centimeters Centimeters (measured) (believed) (measured) (believed) A random sample of students at a college reported what they believed to be their heights in inches. Then the students measured each others' heights in centimeters, without shoes. The data provided are for the men, with their believed heights converted from inches to centimeters. Assume that conditions for t-tests hold. Complete parts a and b below. @ Click the icon to view the data. E) a. Find a 95% condence interval for the mean difference as measured in centimeters. Does it capture 0'? What does that show? The 95% condence interval for measured - believed is ( , (Round to three decimal places as needed.) b. Perform a t-test to test the hypothesis that the means are not the same. Use a significance level of 0.05. Determine the hypotheses for this test. Let udifference be the population mean difference between measured and believed height, in centimeters. Choose the correct answer below. OA. Ho: "difference # 0 OB. Ho: Hdifference = Ha: M difference 0 OE. Ho: Mdifference = 0 OF. Ho: Hdifference = 0 Ha: " difference # 0 Ha: Pdifference > 0 Find the test statistic for this test. t=(Round to two decimal places as needed.) Find the p-value for this test. p-value = (Round to three decimal places as needed.) What is the conclusion for this test? OA. Reject Ho. The means of measured and believed heights are not significantly different. OB. Do not reject Ho. The means of measured and believed heights are significantly different. OC. Do not reject Ho. The means of measured and believed heights are not significantly different. OD. Reject Ho. The means of measured and believed heights are significantly different.Two surfers and statistics students collected data on the number of days on which surfers surfed in the last month for 30 longboard (L) users and 30 shortboard (S) users. Treat these data as though they were from two independent random samples. Test the hypothesis that the mean days surfed for all longboarders is larger than the mean days surfed for all shortboarders (because longboards can go out in many different surfing conditions). Use a level of significance of 0.05. Longboard: 4,8,7,4,9,8,8,6,7, 11, 12, 11, 10, 15, 12, 16, 14, 10, 10, 19, 19, 15, 11, 15, 18,20,9,21,20,24 Shortboard: 6,4,4,6,9,9,6,9,4,8,8,5, 10,8,4, 14,11, 11, 11, 12, 12, 13, 10, 12, 14, 14,9,20, 19, 10 . . . Determine the hypotheses for this test. Choose the correct answer below. OC. HO: HL = HS OB. HO: ML = HS O A. HO: HL > HS Ha: HL P2 Ha:\"1=\"2 Find the test statistic for ales IPAs for this test. t= (Round to two decimal places as needed.) Find the p-value for this test. p-value= (Round to three decimal places as needed.)Figure A and Outputs (Figure A) Food Grocery 1 Grocery 2 Bananas/1 lb 0.99 0.99 Grape tomatoes/1 lb 3.99 4.19 Russet potato/5 lb 4.79 4.49 (Figure B) Paired T-Test and Cl: Grocery 1, Grocery 2 N Mean StDev SE Mean Grocery 1 37 3.01 1.36 0.22 Grocery 2 37 3.01 1.13 0.19 Difference 37 0.00 1.11 0.18 95% CI for difference: ( - 0.370,0.370) T-Test of mean difference = 0 (vs # ): T-Value = 0.00 P-value = 1.000 (Figure C) Two-sample T-Test and Cl: Grocery 1, Grocery 2 N Mean StDev SE Mean Grocery 1 37 3.01 1.36 0.22 Grocery 2 37 3.01 1.13 0.19 Difference = u (Grocery 1) - u (Grocery 2) Estimate for difference: 0.00 95% CI for difference: ( - 0.580,0.580) T-Test of difference = 0 (vs # ): T-Value = 0.00 P-value = 1.000A student compared organic food prices at Grocery 1 and Grocery 2. The same items were priced at each store. The first three items are shown in the accompanying Figure A. Choose the correct accompanying output (B or C) for the appropriate test, explaining why you chose that output. Then test the hypothesis that the population means are not equal using a significance level of 0.05. Assume that all necessary conditions for carrying out a hypothesis test hold. Click the icon to view Figure A and the outputs. Which is the correct output (B or C) for the appropriate test? Explain. O A. Output C is appropriate because the data are independent samples. O B. Output C is appropriate because there are two samples. O C. Output B is appropriate because n 2 25. O D. Output B is appropriate because the data are paired samples.Test the hypothesis that the population means are not equal using a significance level of 0.05. Determine the hypotheses for this test. Let Hdifference be the population mean difference between Grocery 1 prices and Grocery 2 prices. Choose the correct answer below. O A. Ho: Hdifference = 0 O B. Ho: Hdifference = 0 Ha: Hdifference > 0 Ha: Hdifference #0 O C. Ho: Hdifference # 0 O D. Ho: Hdifference 0 Ha Hdifference
Step by Step Solution
There are 3 Steps involved in it

Get step-by-step solutions from verified subject matter experts