

Question: Data: Usually, in the engineering environment, the data are almost always samples, that have been selected from real populations by one of three ways: retrospective
Data: Usually, in the engineering environment, the data are almost always samples, that have been selected from real populations by one of three ways: retrospective studies based on historical data, observational studies or designed experiments.
In this project, each group will collect their own continuous data by themselves to be familiar with the method of collecting data.
Notes: 1.Write the solution of this project in a form of ONE report and type it by using Microsoft Word. 2.Submit the report and the Minitab file to the instructor by email before the due date. There is 2% deduction for every day of lateness. 3.Write the solutions of the questions as decimal numbers (4 digits after the decimal point for probability {e.g. 0.0000} and 2 digits after the decimal point for other numbers {e.g. 0.00} and use comma for every 3 numbers before the decimal point, i.e. period {e.g. 0,000.00}). 4. Write your comment and interpretation at the end of each question. 5.Print, scan and attach any set of data, calculation, graph, solution or output by Minitab or Excel. 6.To attach any table, figure or chart, scan, copy and paste it in the file. 7.Display evidences about conducting the experiment and attending the meetings by all the members by attach photos and meetings minutes.
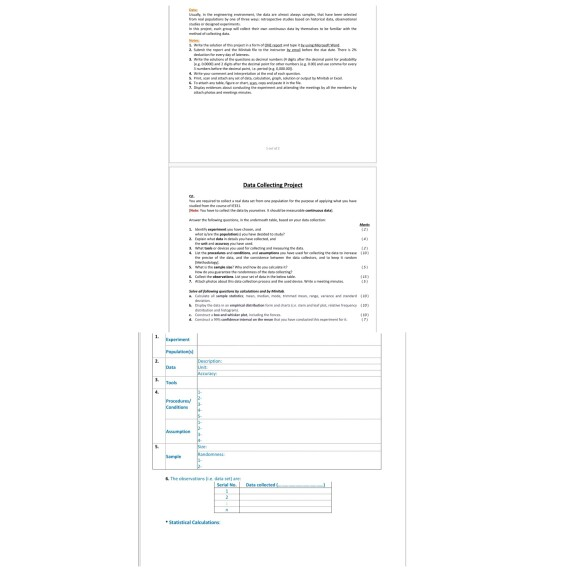
Q1. You are required to collect a real data set from one population for the purpose of applying what you have studied from the course(the course is probability and statistics for engineers and scientists walpole chapter 1,2,3,4,5and 6).
[Note: You have to collect the data by yourselves. It should be measurable continuous data].
Answer the following questions, in the underneath table, based on your data collection:
1.Identify experiment you have chosen, and
what is/are the population(s) you have decided to study?
2.Explain what data in details you have collected, and
the unit and accuracy you have used.
3.What tools or devices you used for collecting and measuring the data.
4.List the procedures and conditions, and assumptions you have used for collecting the data to increase the precise of the data, and the consistence between the data collectors, and to keep it random [Methodology].
5.What is the sample size? Why and how do you calculate it?
How do you guarantee the randomness of the data collecting?
6.Collect the observations. List your set of data in the below table.
7.Attach photos about this data collection process and the used device. Write a meeting minutes.
Solve all following questions by calculations and by Minitab.
a.Calculate all sample statistics; mean, median, mode, trimmed mean, range, variance and standard deviation.
b.Display the data in an empirical distribution form and charts (i.e. stem and leaf plot, relative frequency distribution and histogram).
c.Construct a box and whisker plot, including the fences.
d.Construct a 99% confidence interval on the mean that you have conducted this experiment for it.
Step by Step Solution
There are 3 Steps involved in it

Get step-by-step solutions from verified subject matter experts