

Question: Data Window Help 67% 0 Tue 12:09 AM Excel File Edit View Insert Format Tools AutoSave HESU- O OFF Excel Project-SUM20 Q Home Insert Draw
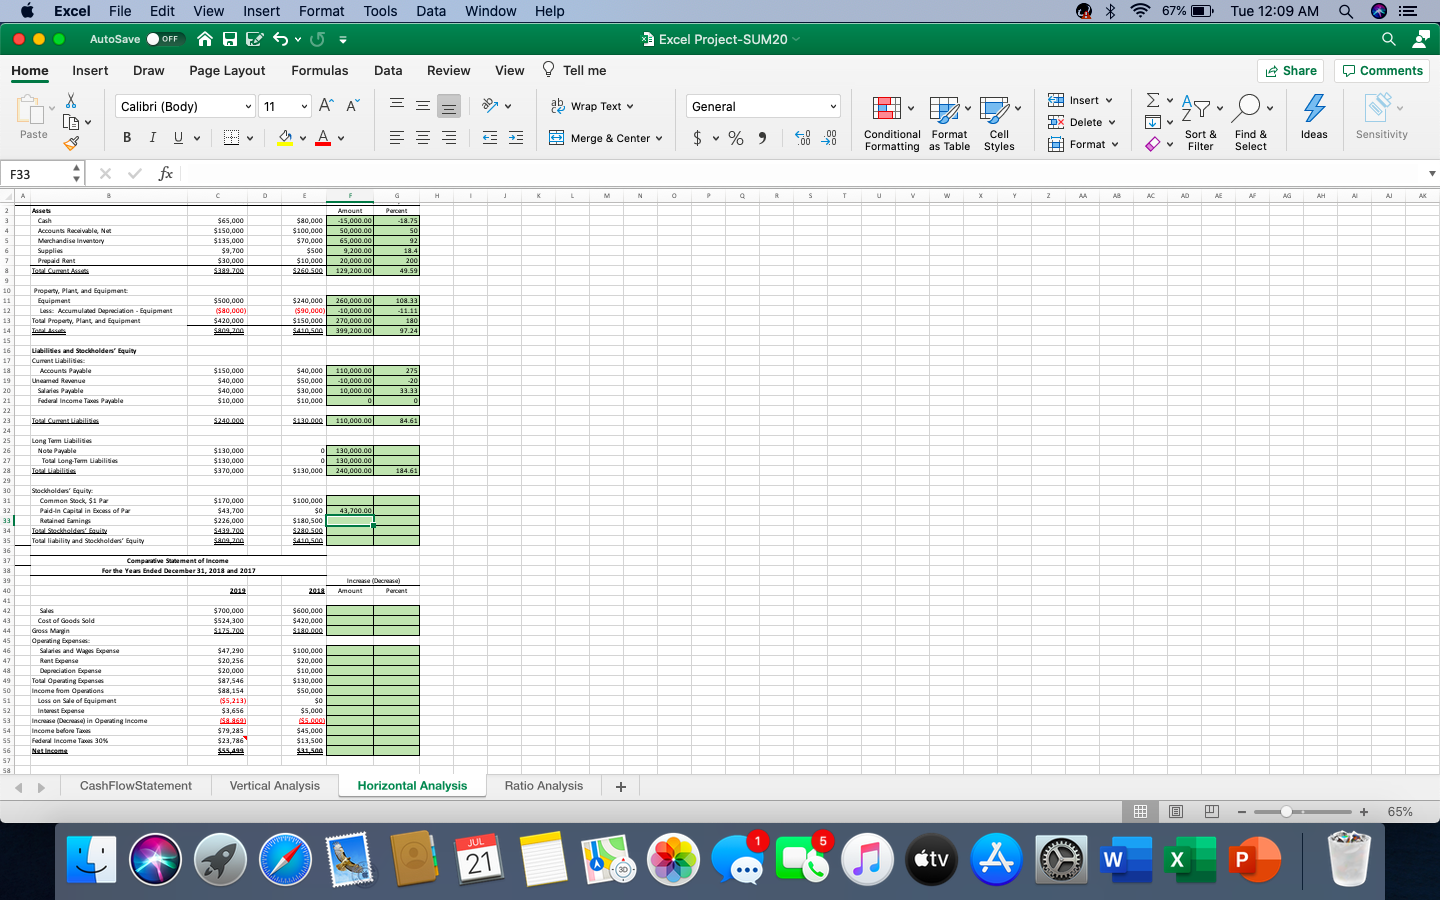
Data Window Help 67% 0 Tue 12:09 AM Excel File Edit View Insert Format Tools AutoSave HESU- O OFF Excel Project-SUM20 Q Home Insert Draw Page Layout Formulas Data Review View Tell me Share Comments Insert Calibri (Body) X LE 11 V Ai ab Wrap Text General PA WE 49 O v V DX Delete Paste B I U A V Merge & Center V $ % ) Ideas .00 > 0 IN V Conditional Format Formatting as Table Cell Styles Sensitivity Sort & Filter ! Format Find & Select F33 4 x fx E F H . L M N P R S T V w X Y Z AA AB AD AE AG AH A AJ AK Asset 2 3 4 S 6 Accounts Receivable, Not Merchandiseinatory Supplies Prepaid Rent Toal.cuments $65,000 $150,000 $135,000 $9,700 $30,000 $289.200 $80,000 $100,000 $70,000 $500 $10,000 $260.500 Amount -15,000.00 50,000.00 65,000.00 9,200.00 20,000.00 129,200.00 Percent -18.75 sol 92 18.4 200 49.59 2 8 9 10 1083 Property, plant, and Equipment Equipment Less: Accumulated Depreciation - Equipment Total Property, Plant, and Equipment $500,000 ($80,000) $420,000 ana Uni $240,000 260,000.00 ($90,000) -10,000.00 $150,000 270,000.00 SASA 399,200.00 180 97.24 12 13 14 15 16 17 Uses and Stockholders' Equity Current Liabilities Accounts Payable Uhamed Ravi Selais Payable Federal income To Payable $150,000 $40,000 $40,000 $10,000 $40,000 $50,000 $30,000 $10,000 110,000.00 -10,000.00 10,000.00 275 -20 33.33 0 Teel Cumminbi $240.000 S130.000 110,000.00 84.61 19 20 21 22 23 24 25 26 27 28 29 30 31 32 33 34 35 Long Term Liabilities No Payable Total Long Term abilities Top $130,000 $130,000 $370,000 0 0 $130,000 130,000.00 130,000.00 240,000.00 184.61 43,700.00 Stockholders' Equity Commen Stock $1 Par Paid-in Capital in Excess of Par Read Gaming Top Soldes Total liability and Stockholders' Equity $170,000 $43,700 $226,000 S439.200 S80 200 $100,000 $0 $180,500 $280.500 s.com 36 32 Comparative Sument of income For the Yeas Ended December 31, 2018 and 2017 39 40 Inca (c Amount Percent 201 2011 43 $700,000 $524,300 $125.700 $600,000 $420,000 $180.000 44 45 42 48 49 SO S1 52 53 54 SS 56 52 Sa Sales Cost of Goods Sold Gross Marin Operating Salaries and waxpanse Rent Expanse Depreciation Expanse Total Owing Expanse Income from Operations Less on Sale of Equipment In rest Epise Increase (Decrease in Opwing income Income before To Federal income To 30% Net Income $47,290 $20,256 $20,000 $87,546 $8,154 $5,213) $3,656 58.8691 $79,285 $23,786 $100,000 $20,000 $10,000 $130,000 $50,000 $0 $5,000 S5.000 $45,000 $13,500 SSA CashFlowStatement Vertical Analysis Horizontal Analysis Ratio Analysis + B + 65% JUL 5 21 Dtv W P
Step by Step Solution
There are 3 Steps involved in it

Get step-by-step solutions from verified subject matter experts