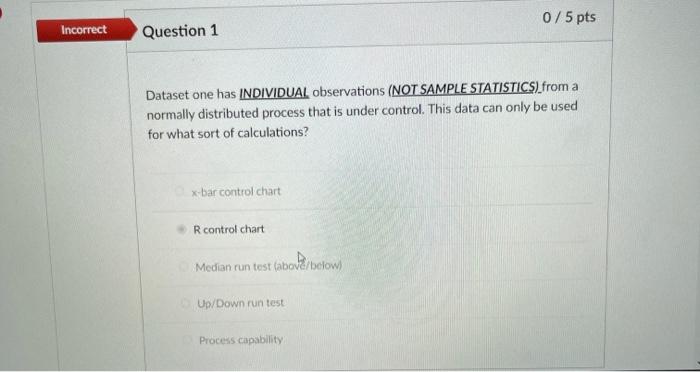
Question: Dataset one has INDIVIDUAL observations (NOT SAMPLE STATISTICS) from a normally distributed process that is under control. This data can only be used for what
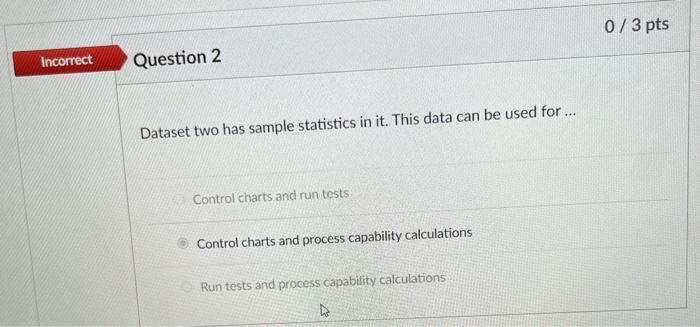
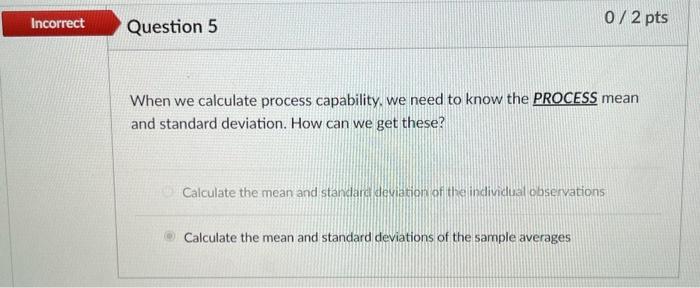
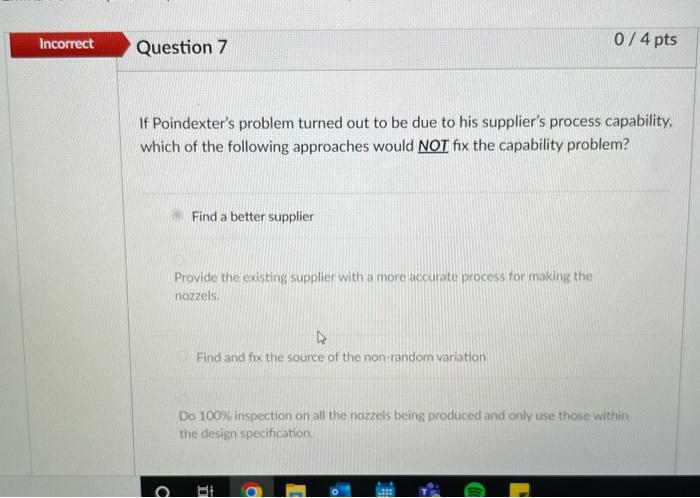
Dataset one has INDIVIDUAL observations (NOT SAMPLE STATISTICS) from a normally distributed process that is under control. This data can only be used for what sort of calculations? x-bar control chart R control chart Median run test (abovef below) Up/Down run test Process capability Dataset two has sample statistics in it. This data can be used for ... Control charts and run tests Control charts and process capability calculations Run tests and process capability calculations When we calculate process capability, we need to know the PROCESS mean and standard deviation. How can we get these? Calculate the mean and standars devation of the individual observations Calculate the mean and standard deviations of the sample averages If Poindexter's problem turned out to be due to his supplier's process capability, which of the following approaches would NOT fix the capability problem? Find a better supplier Provide the existing supplier with a more accurate process for making the nozzels. Find and fix the source of the non-random variation Do 100% inspection on all the nozzels being produced and only use those within the design specification. When I worked with a roll of 1 die in class, you could see that the numbers 1, 2, 3,4,5, and 6 all came up with about equal probability (they each came up about 1/6 of the time). How did the distribution of the average of 4 rolls of the die differ from that? They come up close to 1.0 They come up close to 6.0 They come up close to the middle (close to 3.5) They also come up 1,2,3,4,5, and 6 with equal probability Dataset one has INDIVIDUAL observations (NOT SAMPLE STATISTICS) from a normally distributed process that is under control. This data can only be used for what sort of calculations? x-bar control chart R control chart Median run test (abovef below) Up/Down run test Process capability Dataset two has sample statistics in it. This data can be used for ... Control charts and run tests Control charts and process capability calculations Run tests and process capability calculations When we calculate process capability, we need to know the PROCESS mean and standard deviation. How can we get these? Calculate the mean and standars devation of the individual observations Calculate the mean and standard deviations of the sample averages If Poindexter's problem turned out to be due to his supplier's process capability, which of the following approaches would NOT fix the capability problem? Find a better supplier Provide the existing supplier with a more accurate process for making the nozzels. Find and fix the source of the non-random variation Do 100% inspection on all the nozzels being produced and only use those within the design specification. When I worked with a roll of 1 die in class, you could see that the numbers 1, 2, 3,4,5, and 6 all came up with about equal probability (they each came up about 1/6 of the time). How did the distribution of the average of 4 rolls of the die differ from that? They come up close to 1.0 They come up close to 6.0 They come up close to the middle (close to 3.5) They also come up 1,2,3,4,5, and 6 with equal probability