

Question: Date: 10/02/21 Course: First Course in Business Statistics (1) Assignment: Home V 7. The following is a set of data from a sample of n
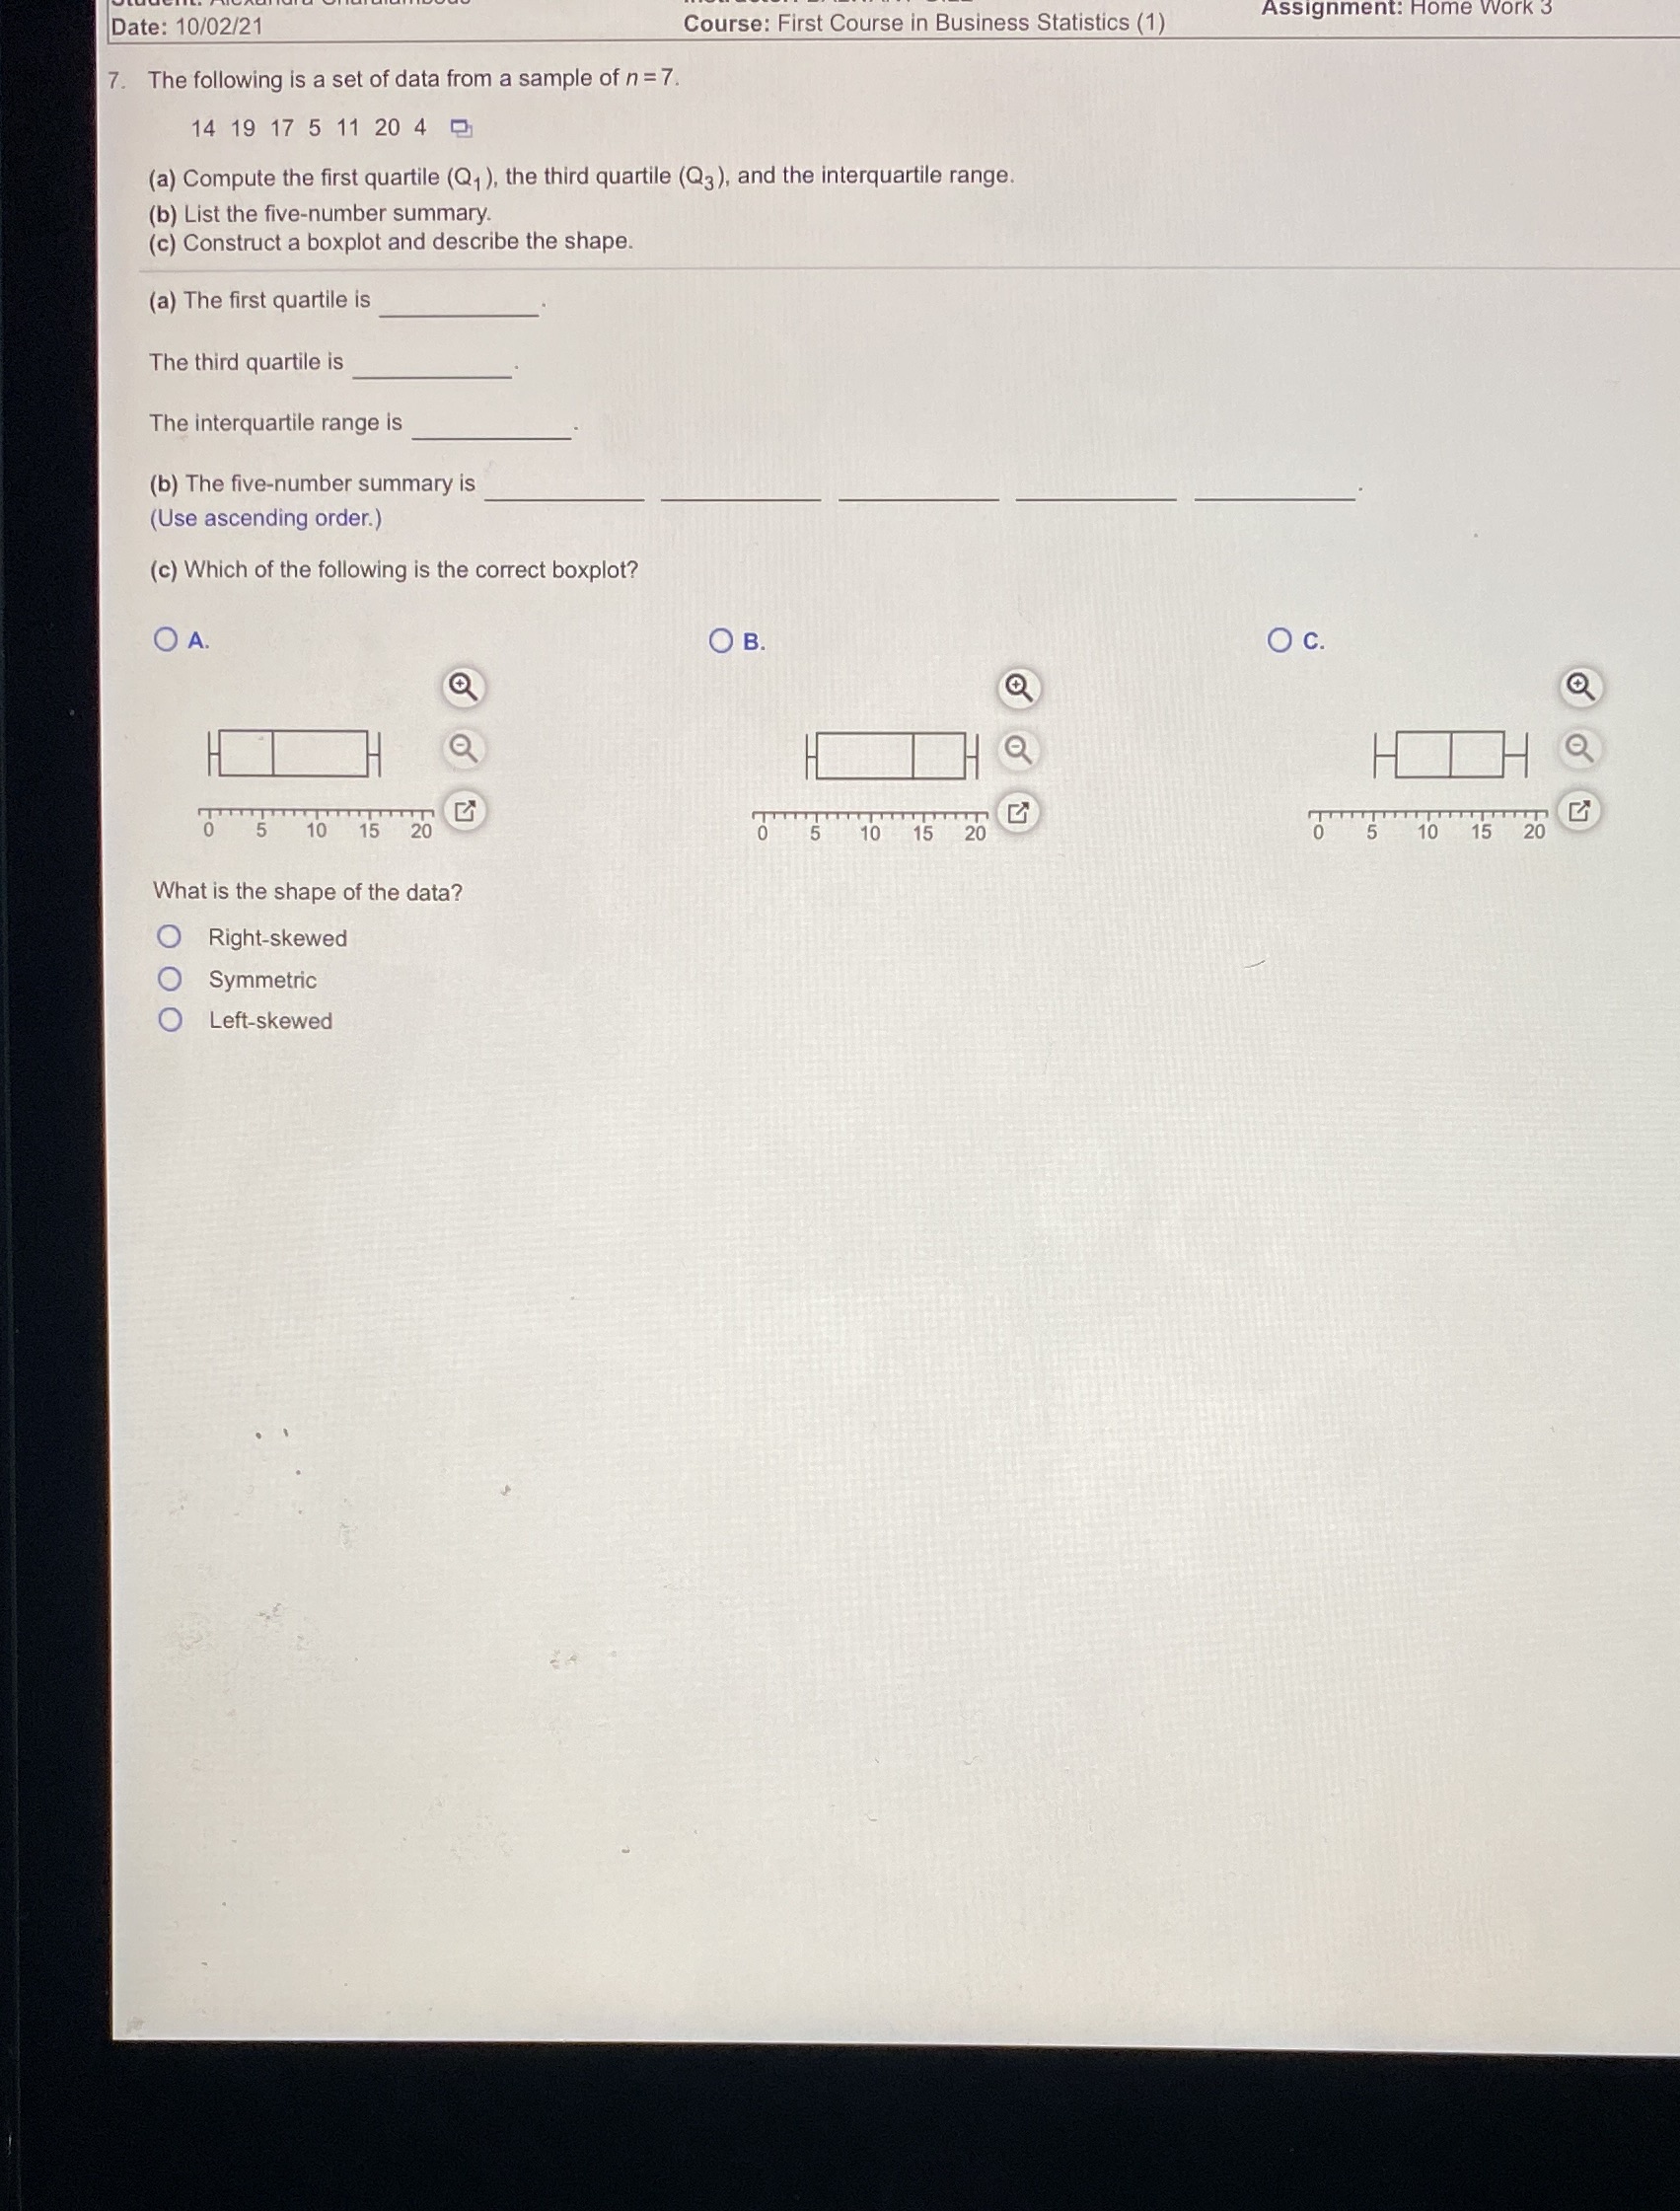
Date: 10/02/21 Course: First Course in Business Statistics (1) Assignment: Home V 7. The following is a set of data from a sample of n = 7. 14 19 17 5 11 20 4 (a) Compute the first quartile (Q, ), the third quartile (Q3 ), and the interquartile range. (b) List the five-number summary. (c) Construct a boxplot and describe the shape. (a) The first quartile is The third quartile is The interquartile range is (b) The five-number summary is (Use ascending order.) (c) Which of the following is the correct boxplot? O A . OB. O C. Q HQ 5 10 15 20 10 15 5 10 15 20 What is the shape of the data? Right-skewed O Symmetric Left-skewed
Step by Step Solution
There are 3 Steps involved in it

Get step-by-step solutions from verified subject matter experts