

Question: DAY begin{tabular}{lcccccccccccccc} & 1 & 2 & 3 & 4 & 5 & 6 & 7 & 8 & 9 & 10 & 11 &
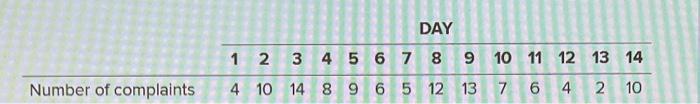
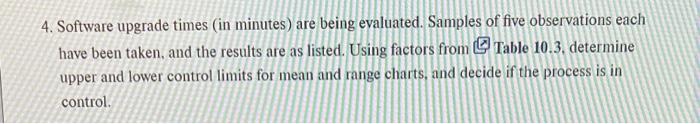
DAY \begin{tabular}{lcccccccccccccc} & 1 & 2 & 3 & 4 & 5 & 6 & 7 & 8 & 9 & 10 & 11 & 12 & 13 & 14 \\ \hline Number of complaints & 4 & 10 & 14 & 8 & 9 & 6 & 5 & 12 & 13 & 7 & 6 & 4 & 2 & 10 \end{tabular} 4. Software upgrade times (in minutes) are being evaluated. Samples of five observations each have been taken, and the results are as listed. Using factors from Table 10.3, determine upper and lower control limits for mean and range charts, and decide if the process is in control
Step by Step Solution
There are 3 Steps involved in it
1 Expert Approved Answer
Step: 1 Unlock

Question Has Been Solved by an Expert!
Get step-by-step solutions from verified subject matter experts
Step: 2 Unlock
Step: 3 Unlock