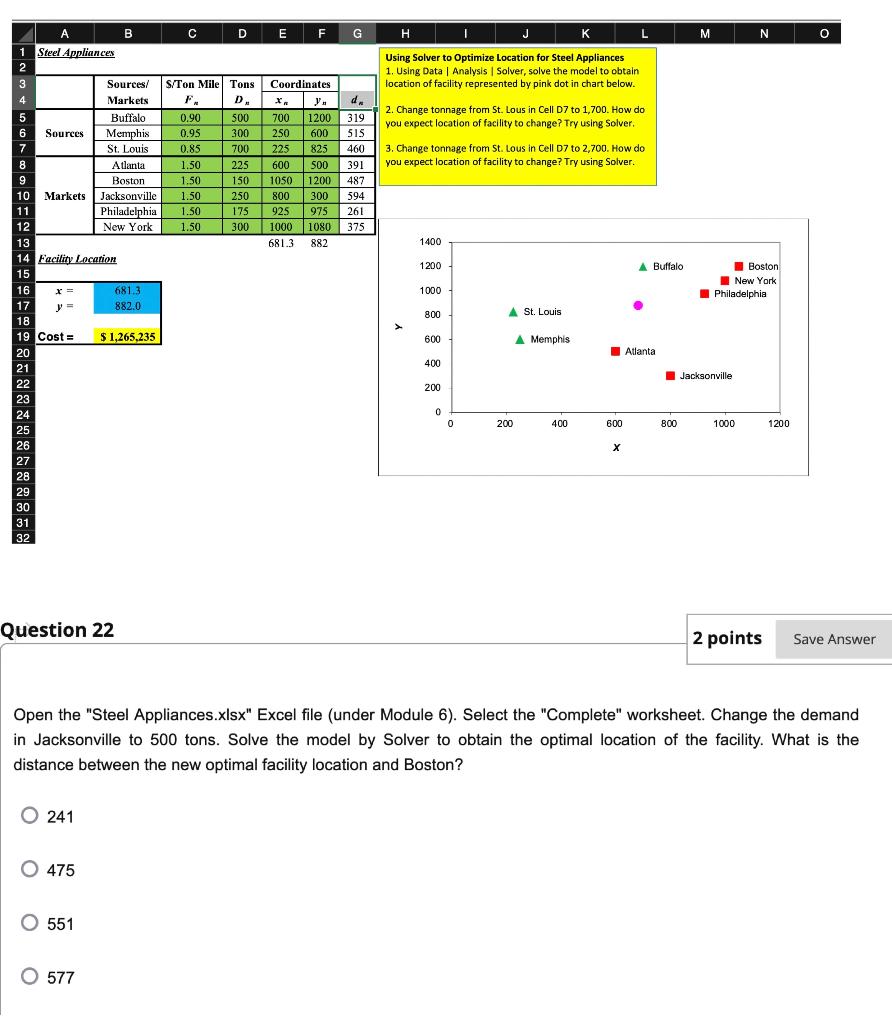
Question: DE F G M N O H J L Using Solver to Optimize Location for Steel Appliances 1. Using Data Analysis Solver, solve the model

DE F G M N O H J L Using Solver to Optimize

DE F G M N O H J L Using Solver to Optimize Location for Steel Appliances 1. Using Data Analysis Solver, solve the model to obtain location of facility represented by pink dot in chart below. D. 2. Change tonnage from St. Lous in Cell D7 to 1,700. How do you expect location of facility to change? Try using Solver. S/Ton Mile Tons F 0.90 500 0.95 300 0.85 700 1.50 225 1.50 150 1.50 250 1.50 175 1.50 300 A B 1 Steel Appliances 2 3 Sources/ 4 Markets 5 Buffalo 6 Sources Memphis 7 St. Louis 8 Atlanta 9 Boston 10 Markets Jacksonville 11 Philadelphia 12 New York 13 14 Facility Location 15 16 681.3 17 882.0 18 $ 1,265,235 20 21 22 2 23 24 25 26 27 Coordinates y. d. 700 1200319 250 600 515 225 825 460 600 500 391 1050 1200 487 800 300 594 925 975 261 1000 1080375 681.3 882 3. Change tonnage from St. Lous in Cell D7 to 2,700. How do you expect location of facility to change? Try using Solver. 1400 1200 A Buffalo Boston New York Philadelphia 1000 800 St. Louis > 19 Costs 600 Memphis Atlanta 400 Jacksonville 200 0 0 200 400 600 800 1000 1200 28 29 30 31 32 Question 22 2 points Save Answer Open the "Steel Appliances.xlsx" Excel file (under Module 6). Select the "Complete" worksheet. Change the demand in Jacksonville to 500 tons. Solve the model by Solver to obtain the optimal location of the facility. What is the distance between the new optimal facility location and Boston? 0241 O 475 O 551 O 577

Step by Step Solution

There are 3 Steps involved in it

1 Expert Approved Answer
Step: 1 Unlock blur-text-image
Question Has Been Solved by an Expert!

Get step-by-step solutions from verified subject matter experts

Step: 2 Unlock
Step: 3 Unlock

Students Have Also Explored These Related General Management Questions!