

Question: Dear Expert The following below is a MATLAB program that uses the Detrended fluctuation Analysis to find the the slope of the line relating log
Dear Expert The following below is a MATLAB program that uses the Detrended fluctuation Analysis to find the the slope of the line relating log F(n) to log n determines the scaling exponent (self-similarity parameter), using the following Algorithm and theory shown just here
In the below program I am unable to do the fluctuation part using the above algorithm and henceforth obtaining my LOCAL DETRENDING GRAPH for my data.The following MATLAB program basically Extracts a text and makes a time series of word position against wordlength
%% Import the text from the file "Taking Responsibility for Your Own Actions pdf.docx" filename = "Taking Responsibility for Your Own Actions pdf.docx"; str = extractFileText(filename); % Preprocess the text by removing punctuation and converting all characters to lowercase str1 = erasePunctuation(str); % Split the text into individual words str2=split(str); %Length of word k=length(str2) %Number of words x=[1:k] % Map each word to its corresponding index of length for i=x:k k(i) = strlength(str2(i)); end
%Plot the random walk time series figure(1) plot(x,k) title('Time Series Plot (Number of Letters against Position of Words)') xlabel('Position of words') ylabel('Number of letters') grid on
numpts=20; llimit=2;rlimit=6;%% limits of box length % Hoenestly Mr Expert I do not know what this is fore can you explai? lgboxlength=linspace(llimit,rlimit,numpts); boxlength= floor(10.^lgboxlength);
%% Calc Fluctuation for each Boxlength s and calc Fsquared for j= 1:numpts j nterms1=boxlength(j); nboxes(j)=floor(nterms1/boxlength(j)); b=nboxes; %% Calc Trend in Each box of length s and calc Fsquared for i=1:b start =(i-1)*nterms1+1; finish=i*nterms1; x=[start:finish]; a=polyfit (x,y(start:finish),1); trend_segment=a(1)*x*a(2) trend(start:finish)=trend_segment; end fluctuation=(1:length(trend)-trend); fluctsq=fluctuation .^2 ; f(j)=sqrt(sum(fluctuation .^2)/length(fluctuation)); clear trend end %% plotting the log-log Graph plot(log10(boxlength),log10(f),'+k-')
In the End the program should give me the following TYPE OF GRAPH OF RESULTS with the trends in my program. Can you help me out why the Matlab program is not working and PLEASE DO SHOW MY MISTAKES AND EXPLAIN TO ME WHY THEY WERE incorrect
THANK YOU VERY MUCH Mr/Mrs Expert .
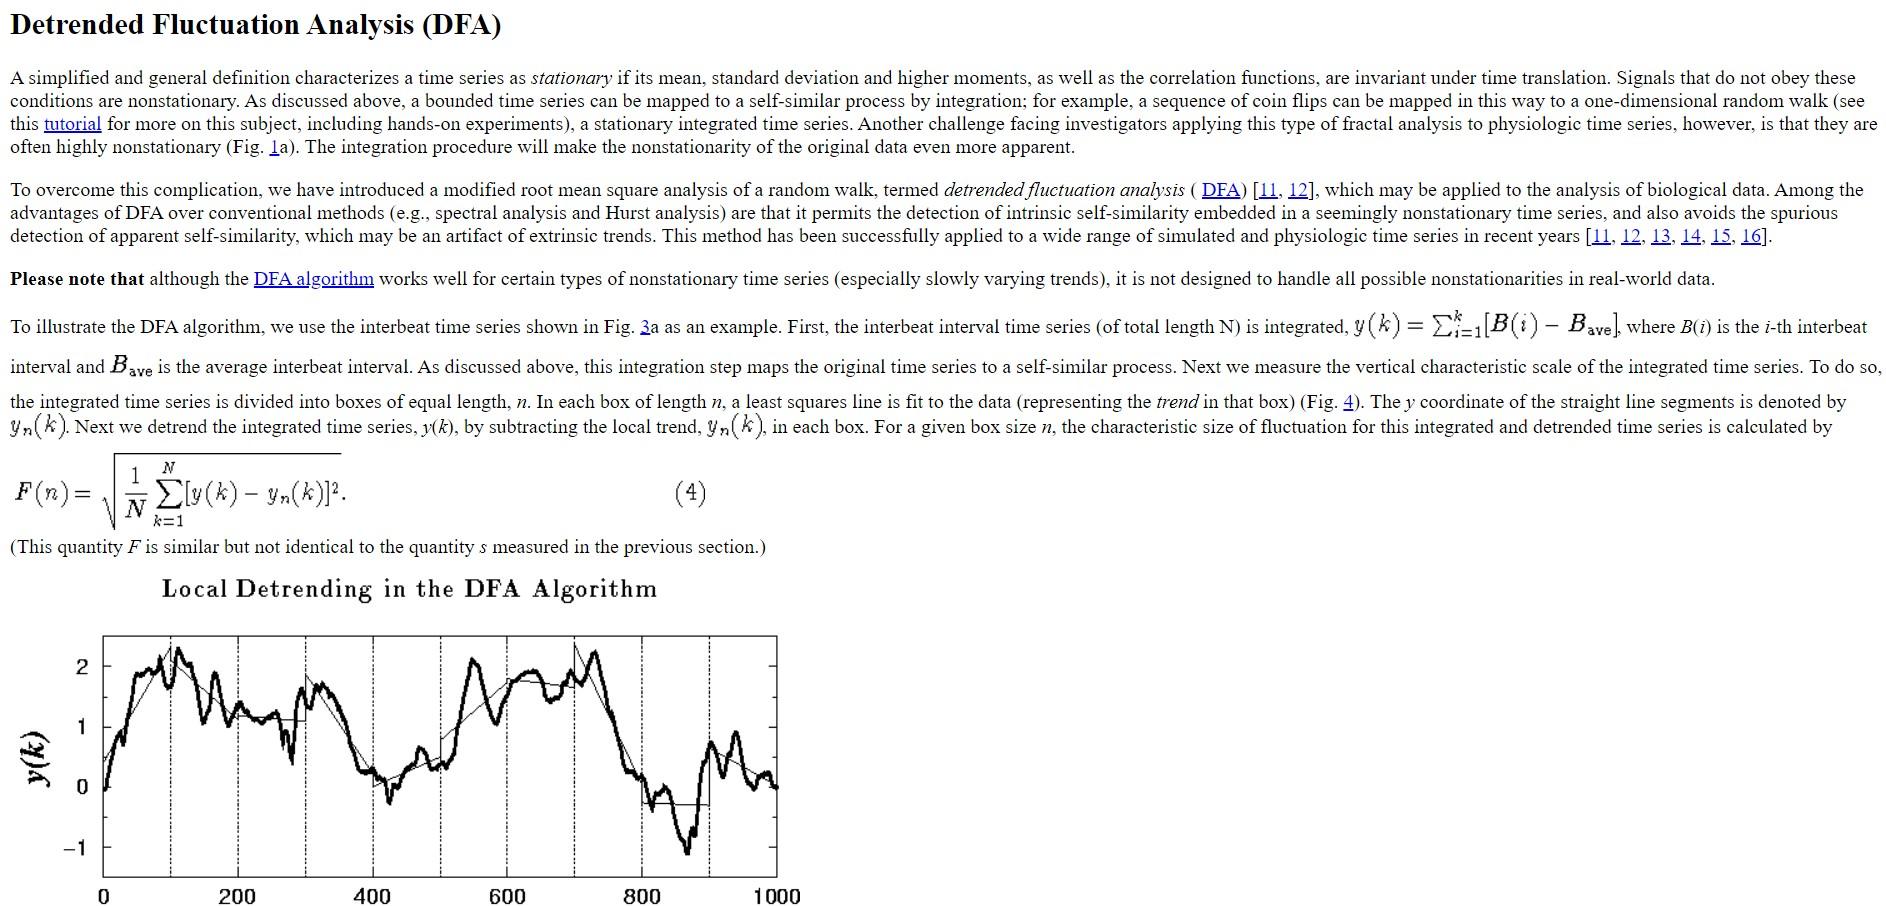
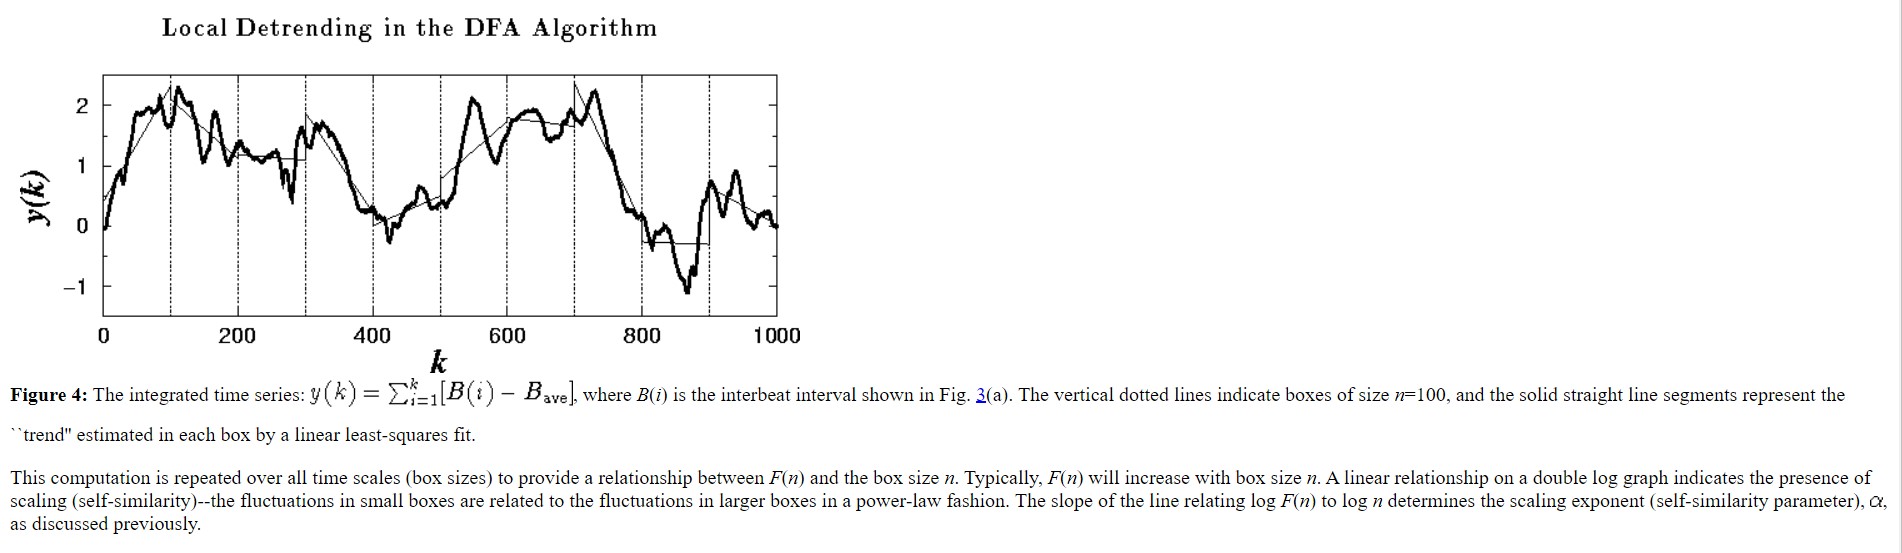
often highly nonstationary (Fig. 1 a). The integration procedure will make the nonstationarity of the original data even more apparent. F(n)=N1k=1N[y(k)yn(k)]2. (This quantity F is similar but not identical to the quantity s measured in the previous section.) Local Detrending in the DFA Algorithm Local Detrending in the DFA Algorithm Figure 4: The integrated time series: y(k)=i=1k[B(i)Bave], where B(i) is the interbeat interval shown in Fig. 3 (a). The vertical dotted lines indicate boxes of size n=100, and the solid straight line segments represent the "trend" estimated in each box by a linear least-squares fit. This computation is repeated over all time scales (box sizes) to provide a relationship between F(n) and the box size n. Typically, F(n) will increase with box size n. A linear relationship on a double log graph indicates the presence of scaling (self-similarity)--the fluctuations in small boxes are related to the fluctuations in larger boxes in a power-law fashion. The slope of the line relating logF(n) to logn determines the scaling exponent (self-similarity parameter), , as discussed previously
Step by Step Solution
There are 3 Steps involved in it

Get step-by-step solutions from verified subject matter experts