

Question: Dear Expert this is the MATLAB program for the Detrended fluctuation analysis for a text. There is an error still at 'fluctuation = zeros(1,k); %
Dear Expert this is the MATLAB program for the Detrended fluctuation analysis for a text. There is an error still at 'fluctuation = zeros(1,k); % corrected error here' when running the program on matlab ONLINE I get the following:
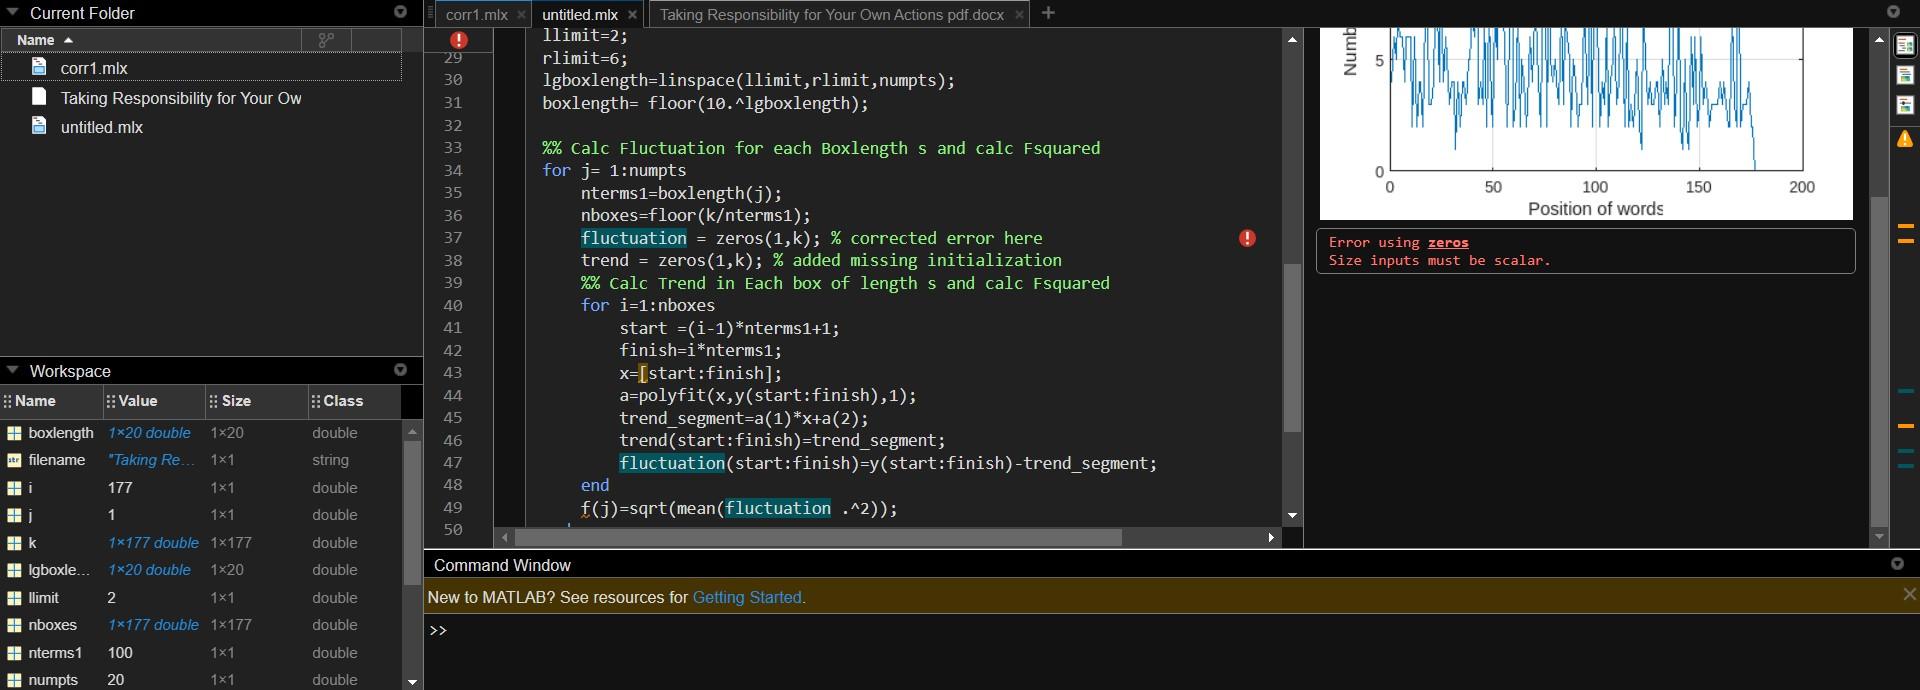
(There are a few errors in the provided code, which are causing the program to fail. Here's the corrected code:) Sorry as you can see above at the exclamation mark the error still persist can you figure it out please.Else you've done an amazing job .Thank you very much .still this issue is persisting.It is saying "ERROR USING ZEROS SIZE INPUTS MUST BE SCALAR. "BUT WHY IS IT SAYING THiS x and K are both vectors hmm .
%% Import the text from the file "Taking Responsibility for Your Own Actions pdf.docx"
filename = "Taking Responsibility for Your Own Actions pdf.docx";
str = extractFileText(filename);
% Preprocess the text by removing punctuation and converting all characters to lowercase
str1 = erasePunctuation(str);
% Split the text into individual words
str2=split(str1);
%Length of word
k=length(str2);
%Number of words
x=[1:k];
% Map each word to its corresponding index of length
for i=x:k
k(i) = strlength(str2(i));
end
y = k;
%Plot the random walk time series
figure(1)
plot(x,y)
title('Time Series Plot (Number of Letters against Position of Words)')
xlabel('Position of words')
ylabel('Number of letters')
grid on
numpts=20;
llimit=2;
rlimit=6;
lgboxlength=linspace(llimit,rlimit,numpts);
boxlength= floor(10.^lgboxlength);
%% Calc Fluctuation for each Boxlength s and calc Fsquared
for j= 1:numpts
nterms1=boxlength(j);
nboxes=floor(kterms1);
fluctuation = zeros(1,k); % corrected error here HERE THE ERROR IS STILL PERSISTING
trend = zeros(1,k); % added missing initialization
%% Calc Trend in Each box of length s and calc Fsquared
for i=1:nboxes
start =(i-1)*nterms1+1;
finish=i*nterms1;
x=[start:finish];
a=polyfit(x,y(start:finish),1);
trend_segment=a(1)*x+a(2);
trend(start:finish)=trend_segment;
fluctuation(start:finish)=y(start:finish)-trend_segment;
end
f(j)=sqrt(mean(fluctuation .^2));
end
%% plotting the log-log Graph
figure(2) % corrected error here
plot(log10(boxlength),log10(f),'+k-')
title('Detrended Time Series Plot (Number of Letters against Position of Words)')
xlabel('Logarithm of box length')
ylabel('Logarithm of fluctuation')
grid on
Thank you ,pls can you run the program and show me the result as well
Step by Step Solution
There are 3 Steps involved in it

Get step-by-step solutions from verified subject matter experts