

Question: Define a function, plot _ temperature _ histogram ( Ts , bins, range ) , which produces a histogram ( as a matplotlib figure )
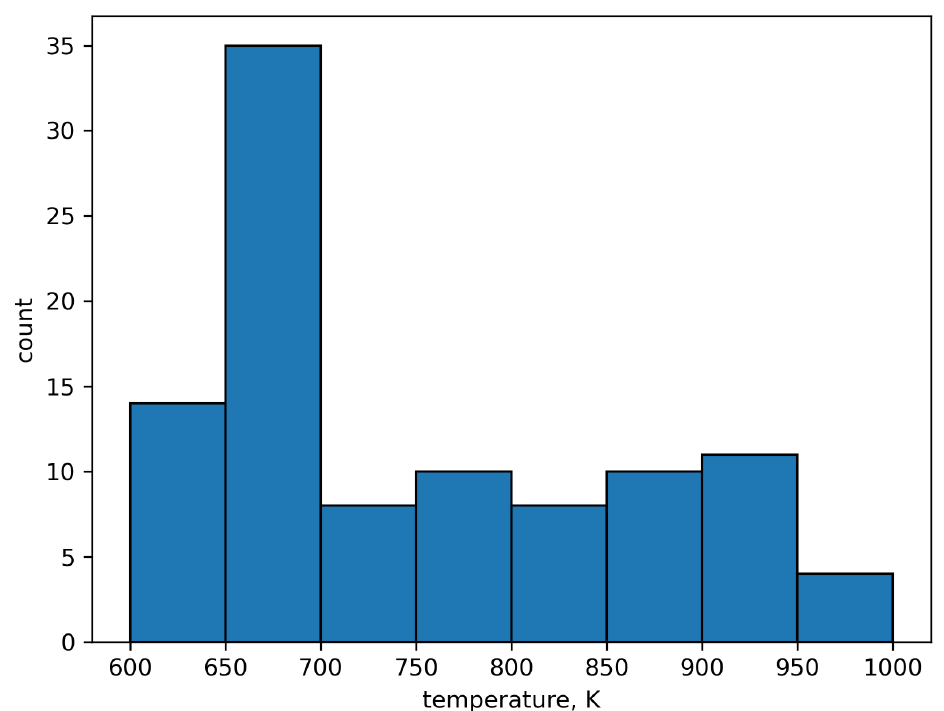
Define a function, plottemperaturehistogramTs bins, range which produces a histogram as a matplotlib figure showing the temperatures encountered at the end of the random walks grouped into counts based on bins of temperature ranges. The parameter Ts is a numpy array of temperatures from all individual walks; it is part of the output from a call to wostemperatureestimate. The
parameter bins is an integer which indicates how many bins are used in the histogram, and range is a tuple with two floats of form Tmin, Tmax where Tmin is the lower temperature bound for the histogram and Tmax is the upper bound. As a hint, take a look at the matplotlib documentation for producing histograms.
sample
x ; y
length ; epsilon
cnrtemps sw:se:ne:nw:
numberwalks
random.seed
Tavg, Ts wostemperatureestimatex y length, cnrtemps, epsilon,
numberwalks
plottemperaturehistogramTs
Step by Step Solution
There are 3 Steps involved in it
1 Expert Approved Answer
Step: 1 Unlock

Question Has Been Solved by an Expert!
Get step-by-step solutions from verified subject matter experts
Step: 2 Unlock
Step: 3 Unlock