

Question: 4. Recessionary gaps The following graph shows the aggregate expenditure line (AE) for an economy with a current equilibrium output of $200 billion and
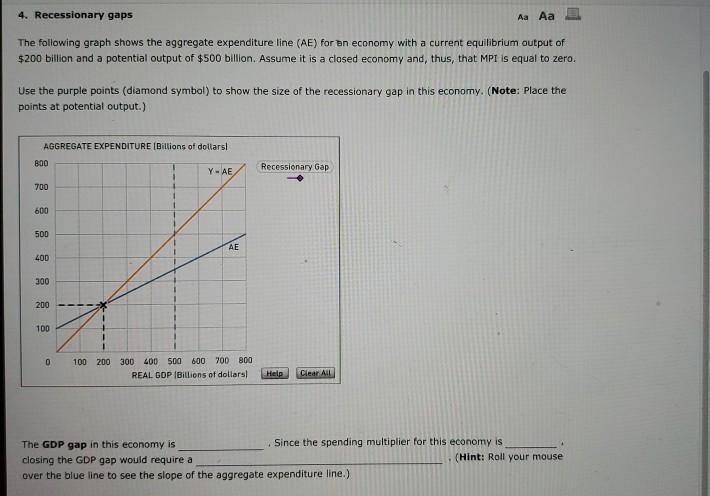
4. Recessionary gaps The following graph shows the aggregate expenditure line (AE) for an economy with a current equilibrium output of $200 billion and a potential output of $500 billion. Assume it is a closed economy and, thus, that MPI is equal to zero. Use the purple points (diamond symbol) to show the size of the recessionary gap in this economy. (Note: Place the points at potential output.) AGGREGATE EXPENDITURE (Billions of dollars! 800 700 600 500 400 300 200 100 0 Y-AE. AE 100 200 300 400 500 600 700 800 REAL GOP (Billions of dollars) Recessionary Gap Help Clear All Since the spending multiplier for this economy is Aa Aa The GDP gap in this economy is closing the GDP gap would require a over the blue line to see the slope of the aggregate expenditure line.). (Hint: Roll your mouse
Step by Step Solution
3.39 Rating (158 Votes )
There are 3 Steps involved in it
1The fiscal multiplier quantifies the change in final national income that results when the government changes expenditures or taxes by a given amount The fiscal multiplier is calculated as Multiplier ... View full answer

Get step-by-step solutions from verified subject matter experts