

Defining the Problem For part 1 of the assignment, you must choose a problem that interests...
Fantastic news! We've Found the answer you've been seeking!
Question:
Transcribed Image Text:
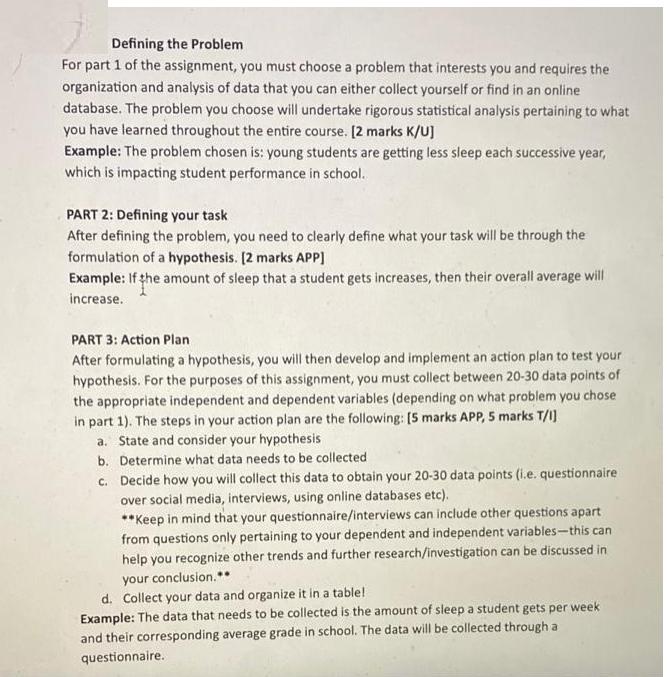
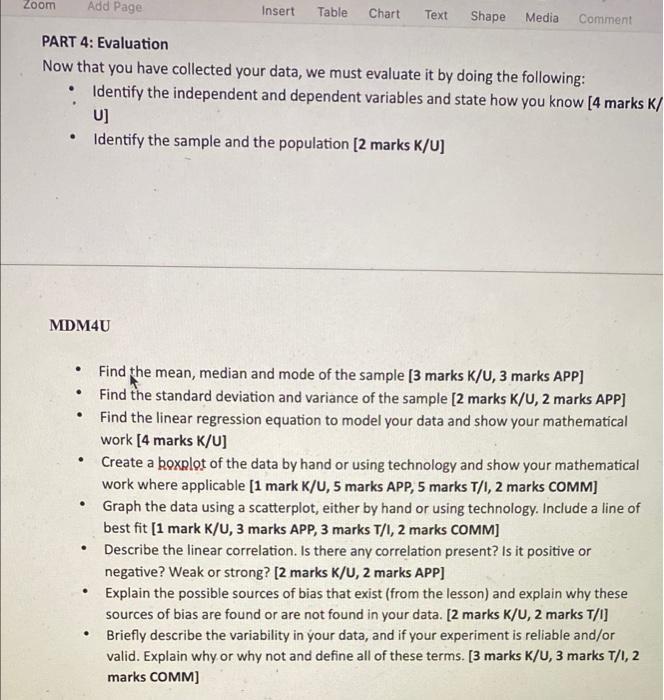
Defining the Problem For part 1 of the assignment, you must choose a problem that interests you and requires the organization and analysis of data that you can either collect yourself or find in an online database. The problem you choose will undertake rigorous statistical analysis pertaining to what you have learned throughout the entire course. [2 marks K/U] Example: The problem chosen is: young students are getting less sleep each successive year, which is impacting student performance in school. PART 2: Defining your task After defining the problem, you need to clearly define what your task will be through the formulation of a hypothesis. [2 marks APP] Example: If the amount of sleep that a student gets increases, then their overall average will increase. PART 3: Action Plan After formulating a hypothesis, you will then develop and implement an action plan to test your hypothesis. For the purposes of this assignment, you must collect between 20-30 data points of the appropriate independent and dependent variables (depending on what problem you chose in part 1). The steps in your action plan are the following: [5 marks APP, 5 marks T/I] a. State and consider your hypothesis b. Determine what data needs to be collected c. Decide how you will collect this data to obtain your 20-30 data points (i.e. questionnaire over social media, interviews, using online databases etc). **Keep in mind that your questionnaire/interviews can include other questions apart from questions only pertaining to your dependent and independent variables-this can help you recognize other trends and further research/investigation can be discussed in your conclusion.** d. Collect your data and organize it in a table! Example: The data that needs to be collected is the amount of sleep a student gets per week and their corresponding average grade in school. The data will be collected through a questionnaire. Zoom Add Page PART 4: Evaluation Now that you have collected your data, we must evaluate it by doing the following: • Identify the independent and dependent variables and state how you know [4 marks K/ U] Identify the sample and the population [2 marks K/U] MDM4U . • Find the mean, median and mode of the sample [3 marks K/U, 3 marks APP] . . Insert Table Chart Text Shape Media Comment . Create a boxplot of the data by hand or using technology and show your mathematical work where applicable [1 mark K/U, 5 marks APP, 5 marks T/I, 2 marks COMM] Graph the data using a scatterplot, either by hand or using technology. Include a line of best fit [1 mark K/U, 3 marks APP, 3 marks T/I, 2 marks COMM] Describe the linear correlation. Is there any correlation present? Is it positive or negative? Weak or strong? [2 marks K/U, 2 marks APP] Explain the possible sources of bias that exist (from the lesson) and explain why these sources of bias are found or are not found in your data. [2 marks K/U, 2 marks T/I] • Briefly describe the variability in your data, and if your experiment is reliable and/or valid. Explain why or why not and define all of these terms. [3 marks K/U, 3 marks T/1, 2 marks COMM] ● ● Find the standard deviation and variance of the sample [2 marks K/U, 2 marks APP] Find the linear regression equation to model your data and show your mathematical work [4 marks K/U] Defining the Problem For part 1 of the assignment, you must choose a problem that interests you and requires the organization and analysis of data that you can either collect yourself or find in an online database. The problem you choose will undertake rigorous statistical analysis pertaining to what you have learned throughout the entire course. [2 marks K/U] Example: The problem chosen is: young students are getting less sleep each successive year, which is impacting student performance in school. PART 2: Defining your task After defining the problem, you need to clearly define what your task will be through the formulation of a hypothesis. [2 marks APP] Example: If the amount of sleep that a student gets increases, then their overall average will increase. PART 3: Action Plan After formulating a hypothesis, you will then develop and implement an action plan to test your hypothesis. For the purposes of this assignment, you must collect between 20-30 data points of the appropriate independent and dependent variables (depending on what problem you chose in part 1). The steps in your action plan are the following: [5 marks APP, 5 marks T/I] a. State and consider your hypothesis b. Determine what data needs to be collected c. Decide how you will collect this data to obtain your 20-30 data points (i.e. questionnaire over social media, interviews, using online databases etc). **Keep in mind that your questionnaire/interviews can include other questions apart from questions only pertaining to your dependent and independent variables-this can help you recognize other trends and further research/investigation can be discussed in your conclusion.** d. Collect your data and organize it in a table! Example: The data that needs to be collected is the amount of sleep a student gets per week and their corresponding average grade in school. The data will be collected through a questionnaire. Zoom Add Page PART 4: Evaluation Now that you have collected your data, we must evaluate it by doing the following: • Identify the independent and dependent variables and state how you know [4 marks K/ U] Identify the sample and the population [2 marks K/U] MDM4U . • Find the mean, median and mode of the sample [3 marks K/U, 3 marks APP] . . Insert Table Chart Text Shape Media Comment . Create a boxplot of the data by hand or using technology and show your mathematical work where applicable [1 mark K/U, 5 marks APP, 5 marks T/I, 2 marks COMM] Graph the data using a scatterplot, either by hand or using technology. Include a line of best fit [1 mark K/U, 3 marks APP, 3 marks T/I, 2 marks COMM] Describe the linear correlation. Is there any correlation present? Is it positive or negative? Weak or strong? [2 marks K/U, 2 marks APP] Explain the possible sources of bias that exist (from the lesson) and explain why these sources of bias are found or are not found in your data. [2 marks K/U, 2 marks T/I] • Briefly describe the variability in your data, and if your experiment is reliable and/or valid. Explain why or why not and define all of these terms. [3 marks K/U, 3 marks T/1, 2 marks COMM] ● ● Find the standard deviation and variance of the sample [2 marks K/U, 2 marks APP] Find the linear regression equation to model your data and show your mathematical work [4 marks K/U]
Expert Answer:
Answer rating: 100% (QA)
Answer Independent Variable Amount of sleep a student gets per week Dependent Variable Overall avera... View the full answer

Related Book For 

Business and Administrative Communication
ISBN: 978-0073403182
10th edition
Authors: Kitty o. locker, Donna s. kienzler
Posted Date:
Students also viewed these mathematics questions
-
Planning is one of the most important management functions in any business. A front office managers first step in planning should involve determine the departments goals. Planning also includes...
-
You are an investor who is looking for a place to invest your money. Previous investments have led you to feel that you are only interested in public, unregulated companies. You must choose a company...
-
Case Study: Quick Fix Dental Practice Technology requirements Application must be built using Visual Studio 2019 or Visual Studio 2017, professional or enterprise. The community edition is not...
-
A contract is started on 1 January 2015, with an estimated completion date of 31 December 2016. The final contract price is $1,500,000. In the first year, to 31 December 2015: Costs incurred...
-
The balanced scorecard measures organizational performance along four dimensions. Is it possible that measures on the customer, internal operations, and innovation and learning dimensions could be...
-
When the 25 dogs and cats escaped for the third time that month, the mayor publicly expressed his _______ regarding the clear and ongoing mismanagement of the city kennel. a. Discontentment b....
-
Rework the decision problem in Example 7, supposing that only 3 of the 20 hard drives required repairs within the first year. Data From Example 7 EXAMPLE 7 Comparing four detergents using an F test...
-
Gator Beach Marts, a chain of convenience grocery stores in the Fort Lauderdale area, has store hours that fluctuate from month to month as the tourist trade in the community varies. The utility...
-
At the beginning of 20x7, the accounts receivable had a beginning balance of $20,000 and allowance for doubtful accounts had a beginning credit balance of 3,000. The following information occurs...
-
The balances in the general ledger accounts of Thunder Graphics are shown below. Instructions On the forms provided in your working papers: 1 . Open the accounts in the general ledger with their...
-
One of the weaknesses of the GDP measurements of the size of the economy is the lack of accounting for the "underground economy." What is this and in what way does it create measurement problem? In...
-
Develop a survey instrument to measure attitudes toward jogging. Have 10 people complete the survey and then report your findings. How could these findings be used by your local running club to...
-
Assume that the Sharpe-Lintner CAPM holds, so the mean-variance efficient frontier consists of combinations of Treasury bills and the market portfolio. Nonetheless, some households make the mistake...
-
The records of Mandys Boutique report the following data for the month of April. Instructions Compute the ending inventory by the conventional retail inventory method. Sales 95,000 Purchases (at...
-
Aykroyd Inc. has sponsored a noncontributory, defined benefit pension plan for its employees since 1989. Prior to 2015, cumulative net pension expense recognized equaled cumulative contributions to...
-
The financial statements of AB InBevs (BEL) 2012 annual report disclosed the following information. Instructions Compute AB InBevs (a) inventory turnover and (b) average days to sell inventory for...
-
Research the "employment-at-will" exemption status for the state Texas. In addition, take a position on whether or not this "covenant of good faith and fair dealing" should be adopted or repealed in...
-
You are planning to purchase your first home five years from today. The required down payment will be $50,000. You currently have $20,000. but you plan to contribute $500 each quarter to a special...
-
Today you received the following message in your mailbox: Dear (Your Name), Thank you for your membership with Fit4Life. We hope you are enjoying our fitness club and that youre reaching your health...
-
What are some characteristics to consider when analyzing individuals?
-
The following Executive Summary is poorly organized and too long. Rearrange information to make it more effective. Cut information that does not belong in the summary. You may use different words as...
-
For the data set below, use a partial \(F\)-test to determine whether the variables \(x_{4}\) and \(x_{5}\) do not significantly help to predict the response variable, \(y\). Use the \(\alpha=0.10\)...
-
Suppose we record the gender of the 15 students enrolled in an introductory statistics course as they enter the classroom. The males are denoted by a blue M and the females are denoted by a red...
-
A nutritionist wants to develop a model that describes the relation between the calories, total fat content, protein, sugar, and carbohydrates in cheeseburgers at fast-food restaurants. She obtains...

Study smarter with the SolutionInn App