

Question: demonstrate data in circle graph, line graph and bar graph 76.0 P70-89. A Child's Day: 2000 (Selected Indicators of Child Woll-Being) Table D10. Family Television
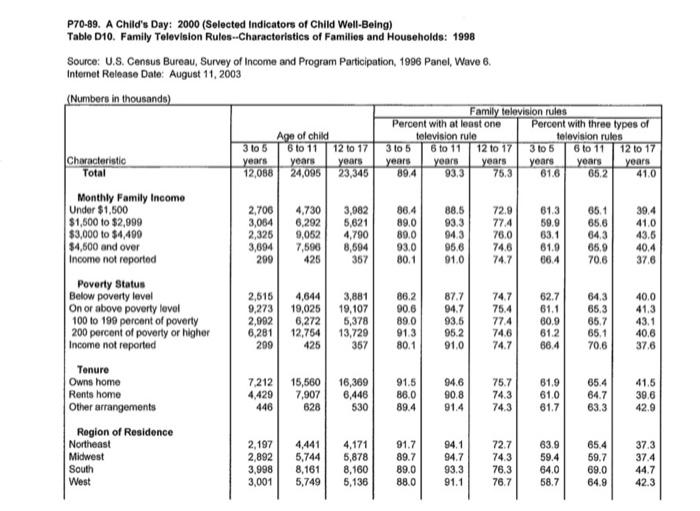
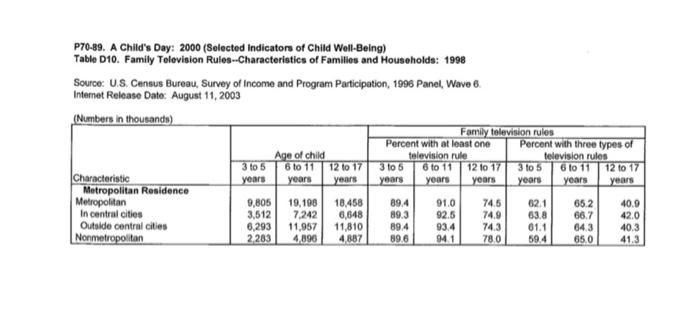
76.0 P70-89. A Child's Day: 2000 (Selected Indicators of Child Woll-Being) Table D10. Family Television Rules --Characteristics of Families and Households: 1998 Source: U.S. Census Bureau, Survey of Income and Program Participation, 1996 Panel, Wave 6. Internet Release Date: August 11, 2003 (Numbers in thousands) Family television rules Percent with at least one Percent with three types of Age of child television rule television rules 3 to 5 6 to 11 12 to 17 3 to 5 6 to 11 12 to 17 3 to 5 6 to 11 12 to 17 Characteristic years years years years years years years years years Total 12,088 24,095 23,345 89.4 93,3 75.3 61.6 65.2 41.0 Monthly Family Incomo Under $1,500 2,706 4.730 3,982 86.4 88.5 72.9 61.3 65.1 39.4 $1,500 to $2,999 3,064 6,292 5,621 89.0 93.3 77.4 59.9 65.6 41.0 $3,000 to $4,400 2,325 9,052 4,790 89.0 94.3 63.1 64.3 43.5 $4,500 and over 3,894 7,590 8,594 93.0 95,6 74.6 61.9 65.9 40.4 Income not reported 200 425 357 80.1 01.0 74.7 06.4 70.6 37.6 Poverty Status Below poverty level 2,515 4,644 3,881 86.2 87.7 74.7 62.7 64.3 40.0 On or above poverty level 9,273 19,025 19,107 90.6 94.7 75.4 61.1 65,3 41.3 100 to 190 percent of poverty 2,092 6,272 5,378 890 93.5 77.4 80,9 65.7 43.1 200 percent of poverty or higher 6,281 12,754 13,729 91.3 95.2 74.6 61.2 65.1 40.6 Income not reported 299 425 357 80.1 91.0 74.7 66.4 70.6 37.6 Tenure Owns home 7.212 15,560 16,369 91.5 94.6 75.7 61.9 65.4 41.5 Rents home 4,429 7,907 6,446 90.8 74.3 61.0 64.7 39.6 Other arrangements 446 628 530 89.4 91.4 74.3 61.7 63.3 42.9 Region of Residence Northeast 2,197 4,441 91.7 94.1 72.7 63.9 65.4 37.3 Midwest 2,892 5,744 5,878 89.7 94.7 74.3 59.4 59.7 37.4 South 3,998 8,161 8,160 89.0 93.3 76.3 64.0 69.0 44.7 West 3,001 5,749 5,136 88.0 91.1 76.7 58.7 64.9 42.3 86.0 4,171 P70-89. A Child's Day: 2000 (Selected indicator of Child Well-Being) Table D10. Family Television Rules--Characteristics of Families and Households: 1998 Source: U.S. Census Bureau, Survey of Income and Program Participation, 1996 Panel, Wave 8. Internet Release Date: August 11, 2003 (Numbers in thousands) Family television rules Percent with at least one Percent with three types of Age of child television rule television rules 3 to 5 6 to 11 12 to 17 3 to 5 6 to 11 12 to 17 3 to 5 6 to 11 12 to 17 Characteristic years years years years years years years years years Metropolitan Residence Metropolitan 9,805 19,190 18.458 89.4 91.0 74,5 62 1 65.2 40,9 In central cities 3,512 7.242 6,648 89.3 92.5 74.9 03.8 66.7 42.0 Outside central cities 6,293 11,957 11,810 89.4 93.4 74.3 61.1 64.3 40.3 Nonmetropolitan 2283 4.890 4,887 89.6 94.1 78 0 59.4 65.0 41.3
Step by Step Solution
There are 3 Steps involved in it

Get step-by-step solutions from verified subject matter experts