

Question: Read the attached table. Create a circle graph, line graph, or a bar graph. You can choose one aspect of the data found on the

Read the attached table. Create a circle graph, line graph, or a bar graph. You can choose one aspect of the data found on the table, you are not expected to include everything. Explain why you choose that type of graph.
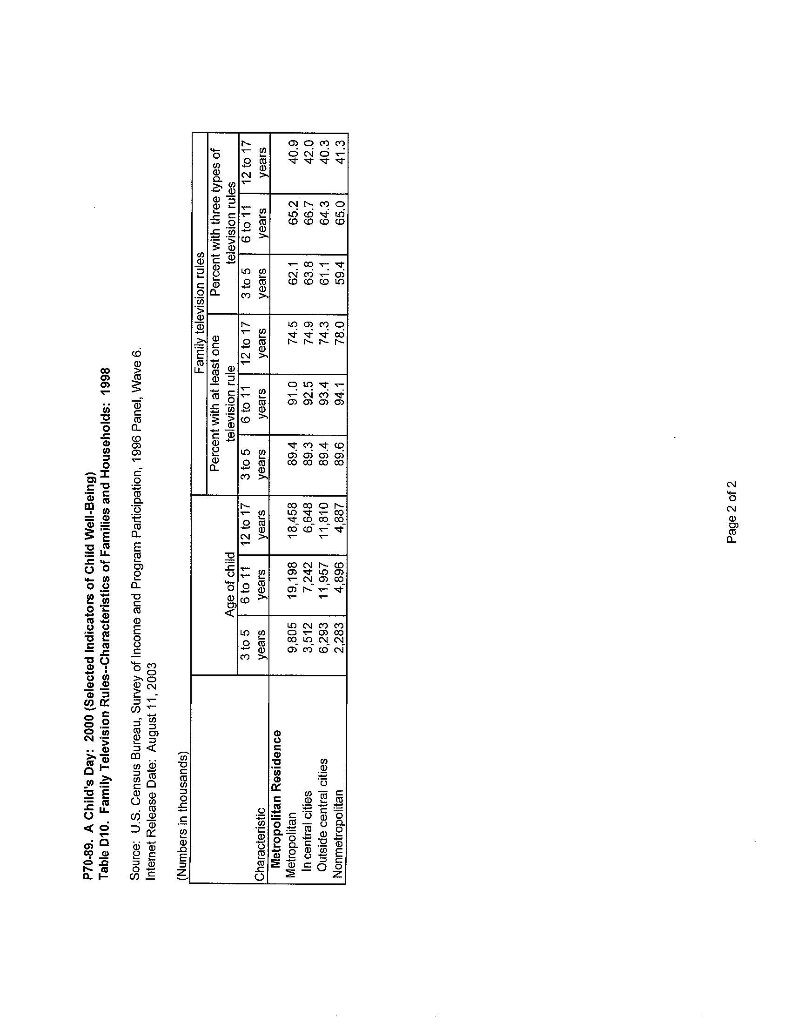
3. Read the attached Table D10: Family Television Rules from a US Census Bureau report and use the information to create a circle graph, a line graph, or a bar graph. You may construct more than one if you need to. You can choose one aspect of the data found on the table, you are not expected to include everything! Explain why you chose the type of graph(s) you did to display the data clearly. Title each and label clearly. (10 pts.) P70-89. A Child's Day: 2000 (Selected Indicators of Child Well-Being) Table D10. Family Television Rules--Characteristics of Families and Households: 1998 Source: U.S. Census Bureau, Survey of Income and Program Participation, 1996 Panel, Wave 6. Intemet Release Date: August 11, 2003 (Numbers in thousands) Age of child 3 to 5 6 to 11 years years 12,088 24,095 Family television rules Percent with at least one Percent with three types of television rule television rules 3 to 5 6 to 11 12 to 17 3 to 5 6 to 11 12 to 17 years years years years years years 89.4 93.3 75.3 81.6 65.2 41.0 Characteristic 12 to 17 years 23,345 Total 72.9 Monthly Family Income Under $1,500 $1,500 to $2,999 $3,000 to $4,499 $4,500 and over Income not reported 2,706 3,064 2,325 3,694 299 4,730 6,292 9,052 7,596 425 3,982 5,621 4,790 8,594 357 86.4 89.0 89.0 93.0 80.1 88.5 93.3 94.3 95.6 91.0 77.4 76.0 74.6 74.7 61.3 59.9 63.1 61.9 66.4 65.1 65.6 64.3 65.9 70.6 39.4 41.0 43.5 40.4 37.6 Poverty Status Below poverty level On or above poverty level 100 to 199 percent of poverty 200 percent of poverty or higher Income not reported 2,515 9,273 2,992 6,281 299 4,644 19,025 6,272 12,754 425 3,881 19,107 5,378 13,729 357 86.2 90.6 89.0 91.3 80.1 87.7 94.7 93.5 95.2 91.0 74.7 75.4 77.4 74.6 74.7 62.7 61.1 60.9 61.2 66.4 64.3 65.3 65.7 65.1 70.6 40.0 41.3 43.1 40.6 37.6 Tenure Owns home Rents home Other arrangements 7,212 4,429 446 15,560 7,907 628 16,369 6,446 530 91.5 86.0 89.4 94.6 90.8 91.4 75.7 74.3 74.3 61.9 61.0 61.7 65.4 64.7 63.3 41.5 39.6 42.9 Region of Residence Northeast Midwest South West 2,197 2,892 3,998 3,001 4,441 5,744 8,161 5,749 4,171 5,878 8,160 6,136 91.7 89.7 89.0 88.0 94.1 94.7 93.3 91.1 72.7 74.3 76.3 76.7 63.9 59.4 64.0 58.7 65.4 59.7 69.0 64.9 37.3 37.4 44.7 42.3 Page 1 of 2 P70-89. A Child's Day: 2000 (Selected Indicators of Child Well-Being) Table D10. Family Television Rules -Characteristics of Families and Households: 1998 Source: U.S. Census Bureau, Survey of Income and Program Participation, 1996 Panel, Wave 6. Internet Release Date: August 11, 2003 (Numbers in thousands) Family television rules Percent with at least one Percent with three types of television rule television rules 3 to 5 6 to 11 12 to 17 3 to 5 6 to 11 12 to 17 years years years years years Age of child 6 to 11 years 3 to 5 years 12 to 17 years years Characteristic Metropolitan Residence Metropolitan In central cities Outside central cities Nonmetropolitan 9,805 3,512 6,293 2,283 19,198 7,242 11,957 4,896 18,458 6,648 11,810 4,887 89.4 89.3 89.4 89.6 91.0 92.5 93.4 94.1 74.5 74.9 74.3 78.0 62.1 63.8 61.1 59.4 65.2 66.7 64.3 65.0 40.9 42.0 40.3 41.3 Page 2 of 2 3. Read the attached Table D10: Family Television Rules from a US Census Bureau report and use the information to create a circle graph, a line graph, or a bar graph. You may construct more than one if you need to. You can choose one aspect of the data found on the table, you are not expected to include everything! Explain why you chose the type of graph(s) you did to display the data clearly. Title each and label clearly. (10 pts.) P70-89. A Child's Day: 2000 (Selected Indicators of Child Well-Being) Table D10. Family Television Rules--Characteristics of Families and Households: 1998 Source: U.S. Census Bureau, Survey of Income and Program Participation, 1996 Panel, Wave 6. Intemet Release Date: August 11, 2003 (Numbers in thousands) Age of child 3 to 5 6 to 11 years years 12,088 24,095 Family television rules Percent with at least one Percent with three types of television rule television rules 3 to 5 6 to 11 12 to 17 3 to 5 6 to 11 12 to 17 years years years years years years 89.4 93.3 75.3 81.6 65.2 41.0 Characteristic 12 to 17 years 23,345 Total 72.9 Monthly Family Income Under $1,500 $1,500 to $2,999 $3,000 to $4,499 $4,500 and over Income not reported 2,706 3,064 2,325 3,694 299 4,730 6,292 9,052 7,596 425 3,982 5,621 4,790 8,594 357 86.4 89.0 89.0 93.0 80.1 88.5 93.3 94.3 95.6 91.0 77.4 76.0 74.6 74.7 61.3 59.9 63.1 61.9 66.4 65.1 65.6 64.3 65.9 70.6 39.4 41.0 43.5 40.4 37.6 Poverty Status Below poverty level On or above poverty level 100 to 199 percent of poverty 200 percent of poverty or higher Income not reported 2,515 9,273 2,992 6,281 299 4,644 19,025 6,272 12,754 425 3,881 19,107 5,378 13,729 357 86.2 90.6 89.0 91.3 80.1 87.7 94.7 93.5 95.2 91.0 74.7 75.4 77.4 74.6 74.7 62.7 61.1 60.9 61.2 66.4 64.3 65.3 65.7 65.1 70.6 40.0 41.3 43.1 40.6 37.6 Tenure Owns home Rents home Other arrangements 7,212 4,429 446 15,560 7,907 628 16,369 6,446 530 91.5 86.0 89.4 94.6 90.8 91.4 75.7 74.3 74.3 61.9 61.0 61.7 65.4 64.7 63.3 41.5 39.6 42.9 Region of Residence Northeast Midwest South West 2,197 2,892 3,998 3,001 4,441 5,744 8,161 5,749 4,171 5,878 8,160 6,136 91.7 89.7 89.0 88.0 94.1 94.7 93.3 91.1 72.7 74.3 76.3 76.7 63.9 59.4 64.0 58.7 65.4 59.7 69.0 64.9 37.3 37.4 44.7 42.3 Page 1 of 2 P70-89. A Child's Day: 2000 (Selected Indicators of Child Well-Being) Table D10. Family Television Rules -Characteristics of Families and Households: 1998 Source: U.S. Census Bureau, Survey of Income and Program Participation, 1996 Panel, Wave 6. Internet Release Date: August 11, 2003 (Numbers in thousands) Family television rules Percent with at least one Percent with three types of television rule television rules 3 to 5 6 to 11 12 to 17 3 to 5 6 to 11 12 to 17 years years years years years Age of child 6 to 11 years 3 to 5 years 12 to 17 years years Characteristic Metropolitan Residence Metropolitan In central cities Outside central cities Nonmetropolitan 9,805 3,512 6,293 2,283 19,198 7,242 11,957 4,896 18,458 6,648 11,810 4,887 89.4 89.3 89.4 89.6 91.0 92.5 93.4 94.1 74.5 74.9 74.3 78.0 62.1 63.8 61.1 59.4 65.2 66.7 64.3 65.0 40.9 42.0 40.3 41.3 Page 2 of 2
Step by Step Solution
There are 3 Steps involved in it

Get step-by-step solutions from verified subject matter experts