

Question: Dependent Variable: Y Method: Least Squares Date: 05/18/23 Time: 18:06 Sample (adjusted): 1974 2022 Included observations: 49 after adjustments Variable Coefficient Std. Error 1-Statistic
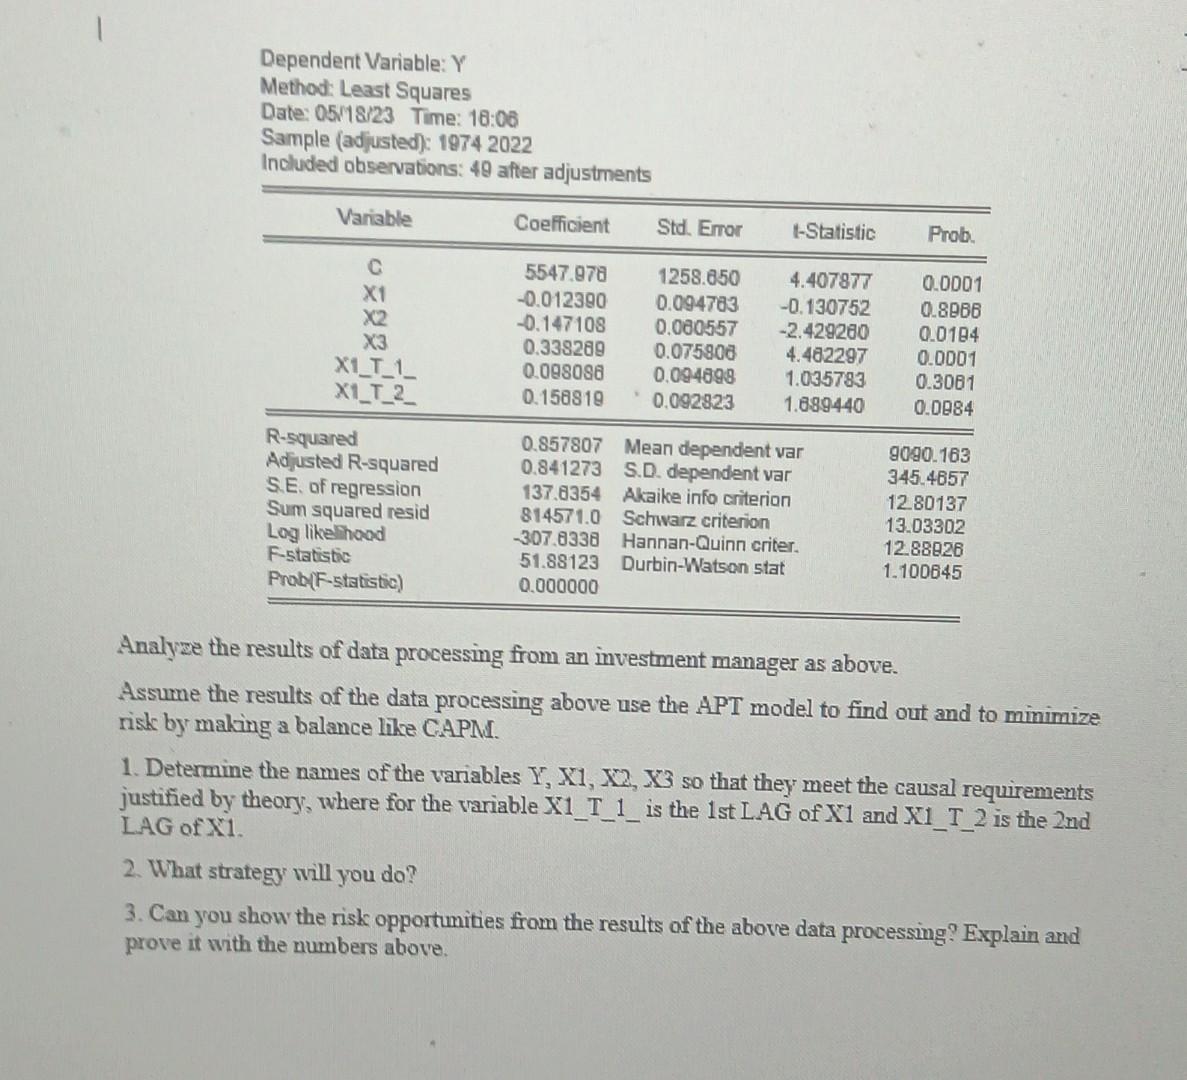
Dependent Variable: Y Method: Least Squares Date: 05/18/23 Time: 18:06 Sample (adjusted): 1974 2022 Included observations: 49 after adjustments Variable Coefficient Std. Error 1-Statistic Prob. C 5547.978 1258.650 4.407877 0.0001 X1 -0.012390 0.094783 -0.130752 0.8966 X2 -0.147108 0.080557 -2.429260 0.0194 X3 0.338289 0.075806 4.482297 0.0001 X1_T_1_ 0.098088 0.094898 1.035783 0.3081 X1_T_2_ 0.158819 * 0.092823 1.689440 0.0984 R-squared 0.857807 Mean dependent var 9090.163 Adjusted R-squared 0.841273 S.D. dependent var 345.4857 S.E. of regression 137.8354 Akaike info criterion 12.80137 Sum squared resid 814571.0 Schwarz criterion 13.03302 Log likelihood -307.8338 Hannan-Quinn criter. 12.88926 F-statistic 51.88123 Durbin-Watson stat 1.100645 Prob(F-statistic) 0.000000 Analyze the results of data processing from an investment manager as above. Assume the results of the data processing above use the APT model to find out and to minimize risk by making a balance like CAPM. 1. Determine the names of the variables Y, X1, X2, X3 so that they meet the causal requirements justified by theory, where for the variable X1_T_1_ is the 1st LAG of X1 and X1_T_2 is the 2nd LAG of X1. 2. What strategy will you do? 3. Can you show the risk opportunities from the results of the above data processing? Explain and prove it with the numbers above.
Step by Step Solution
There are 3 Steps involved in it

Get step-by-step solutions from verified subject matter experts