Question: der to Table 1-factors for Comesting Control Charts for this problem water each containing free parts were taken from a proces that produces se rode
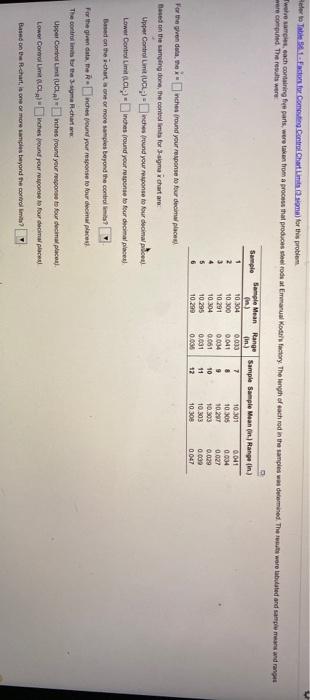
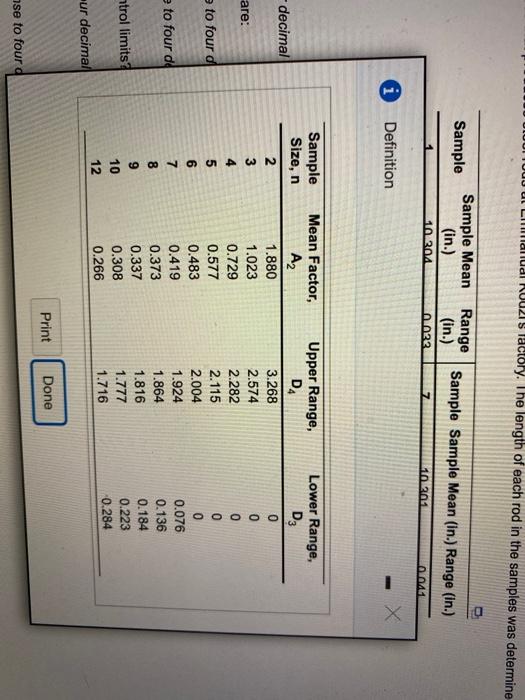
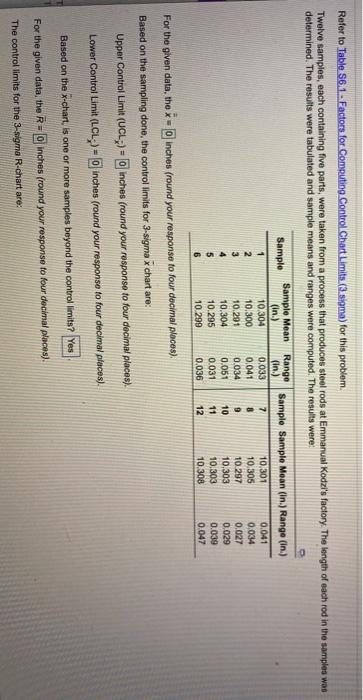
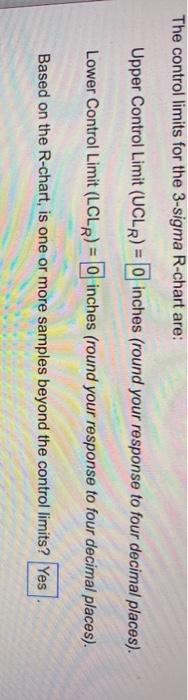
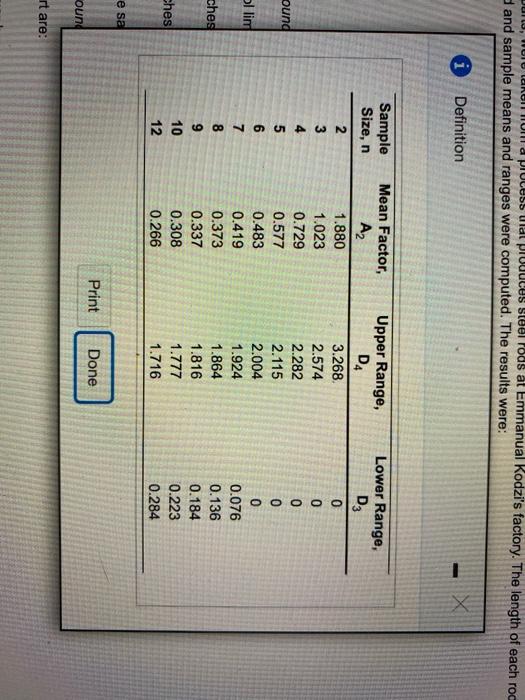
der to Table 1-factors for Comesting Control Charts for this problem water each containing free parts were taken from a proces that produces se rode at Emmanuel Koefactory. The length of each rod in the samples was determined. The results were tabulated and samples and rannt were come The results were Sample 1 2 3 Sample Mean Range an) fin) 10304 0.033 10.300 0011 10.291 10.304 0.051 10.295 0.001 10.299 0.05 004 Sample Sample Mean) Rangen) 7 10.301 0.041 8 10305 0.034 9 10207 0027 10 10.303 0.029 11 10.303 0.009 12 10 300 0047 Per te vendita, ei-nchus round your response to tour de places Based on the saing done, the content for sigma chartar Upper Control Lam (UCL-chround your response to four decima po Low Control Limit Inches fround your response to four decimal places Bated on the itharta one or more samples beyond the control For the given date the inches found your response to four emplaces The contestare 3 cha Upper Control Lint (UCLAnthe fround your response to four decimal pace) LowerCore Limit (LC) che round your response to four decimal places Based on the chart is one or more samples beyond the control LI (00219 Tactory. The length of each rod in the samples was determine Sample Sample Mean Range (in.) (in.) 10.204 n022 Sample Sample Mean (in.) Range (in.) 7 10201 0041 i Definition Sample Size, n Lower Range, D3 0 decimal 2 3 0 are: 0 e to four of 5 Mean Factor, A2 1.880 1.023 0.729 0.577 0.483 0.419 0.373 0.337 0.308 0.266 Upper Range, D4 3.268 2.574 2.282 2.115 2.004 1.924 1.864 1.816 1.777 1.716 6 e to four de 8 0 0.076 0.136 0.184 0.223 0.284 9 atrol limits 10 12 ur decimal Print Done se to four d Refer to Table S61. Factors for Computing Control Chart Limits.(3. sioma) for this problem. Twelve samples, each containing five parts, were taken from a process that produces steel rods at Emmanuel Kodz's factory. The length of each rod in the samples wat determined. The results were tabulated and sample means and ranges were computed. The results were: Sample 1 2 3 Sample Mean Range (in.) (in.) 10.304 0,033 10.300 0.041 10.291 0.034 10.304 0.051 10.295 0.031 10 299 0.036 Sample Sample Mean (in.) Range (in.) 7 10.301 0.041 8 10.305 0.034 9 10 297 0.027 10 10,303 0.029 11 10.303 0.039 12 10.308 0.047 5 6 For the given data, the x = 0 Inches (round your response to four decimal places). Based on the sampling done, the control limits for 3-sigma x chart are: Upper Control Limit (UCL) - inches (round your response to four decimal places) Lower Control Limit (LCL) - inches (round your response to four decimal places) Based on the x-chart, is one or more samples beyond the control limits? Yes For the given data, the R inches (round your response to four decimal places). The control limits for the 3-sigma R-chart are: The control limits for the 3-sigma R-chart are: Upper Control Limit (UCLR) = 0 inches (round your response to four decimal places). Lower Control Limit (LCLR) = 0 inches (round your response to four decimal places). Based on the R-chart, is one or more samples beyond the control limits? Yes U a process ulat produces steel rods at Emmanual Rodzi's factory. The length of each roc and sample means and ranges were computed. The results were: i Definition - Sample Size, n ound Mean Factor, A2 1.880 1.023 0.729 0.577 0.483 0.419 0.373 0.337 0.308 0.266 2 3 4 5 6 7 8 9 10 12 Upper Range, D4 3.268 2.574 2.282 2.115 2.004 1.924 1.864 1.816 1.777 1.716 Lower Range, D3 0 0 0 0 0 0.076 0.136 0.184 0.223 0.284 llim ches ches e sa Print Done ound rt are