

Question: der/AutoGraderPresentationUX.aspx? Ecel MOS Grader 5 (PC and Mac) Assignment Instructions Step Instructions Point Value 0 Start Excel. Download and open the file named Student_MOS19_XL_PROJ5_Charts.xlsx. Save
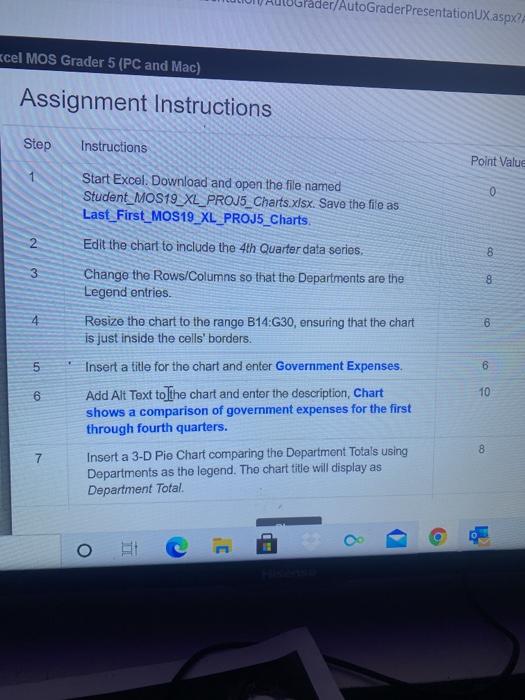
der/AutoGraderPresentationUX.aspx? Ecel MOS Grader 5 (PC and Mac) Assignment Instructions Step Instructions Point Value 0 Start Excel. Download and open the file named Student_MOS19_XL_PROJ5_Charts.xlsx. Save the file as Last_First_MOS19_XL_PROJ5_Charts Edit the chart to include the 4th Quarter data series, 2 C00 3 4 OP 5 6 Change the Rows/Columns so that the Departments are the Legend entries. Resize the chart to the range B14:G30, ensuring that the chart is just inside the cells' borders. Insert a title for the chart and enter Government Expenses Add Alt Text to the chart and enter the description, Chart shows a comparison of government expenses for the first through fourth quarters. Insert a 3-D Pie Chart comparing the Department Totals using Departments as the legend. Tho chart title will display as Department Total CO 10 8 7 - a O der/AutoGraderPresentationUX.aspx? Ecel MOS Grader 5 (PC and Mac) Assignment Instructions Step Instructions Point Value 0 Start Excel. Download and open the file named Student_MOS19_XL_PROJ5_Charts.xlsx. Save the file as Last_First_MOS19_XL_PROJ5_Charts Edit the chart to include the 4th Quarter data series, 2 C00 3 4 OP 5 6 Change the Rows/Columns so that the Departments are the Legend entries. Resize the chart to the range B14:G30, ensuring that the chart is just inside the cells' borders. Insert a title for the chart and enter Government Expenses Add Alt Text to the chart and enter the description, Chart shows a comparison of government expenses for the first through fourth quarters. Insert a 3-D Pie Chart comparing the Department Totals using Departments as the legend. Tho chart title will display as Department Total CO 10 8 7 - a O
Step by Step Solution
There are 3 Steps involved in it

Get step-by-step solutions from verified subject matter experts