

Question: Describe what is being shown by the graph below, relating to Nielsen's research? 100% 75% E 50% 25% Proportion of Usability Problems Found 0%
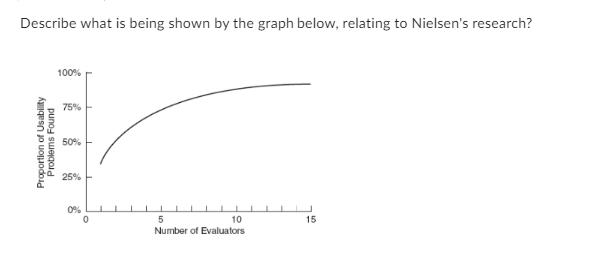
Describe what is being shown by the graph below, relating to Nielsen's research? 100% 75% E 50% 25% Proportion of Usability Problems Found 0% 0 5 10 Number of Evaluators 15
Step by Step Solution
★★★★★
3.38 Rating (154 Votes )
There are 3 Steps involved in it
1 Expert Approved Answer
Step: 1 Unlock

This is a line graph that shows the results of Nie... View full answer
Question Has Been Solved by an Expert!
Get step-by-step solutions from verified subject matter experts
Step: 2 Unlock
Step: 3 Unlock