

Question: from the above mentioned study provide the conclusions values, and as for the second, we used as to Replace Missing Values which had replaced the
from the above mentioned study provide the conclusions
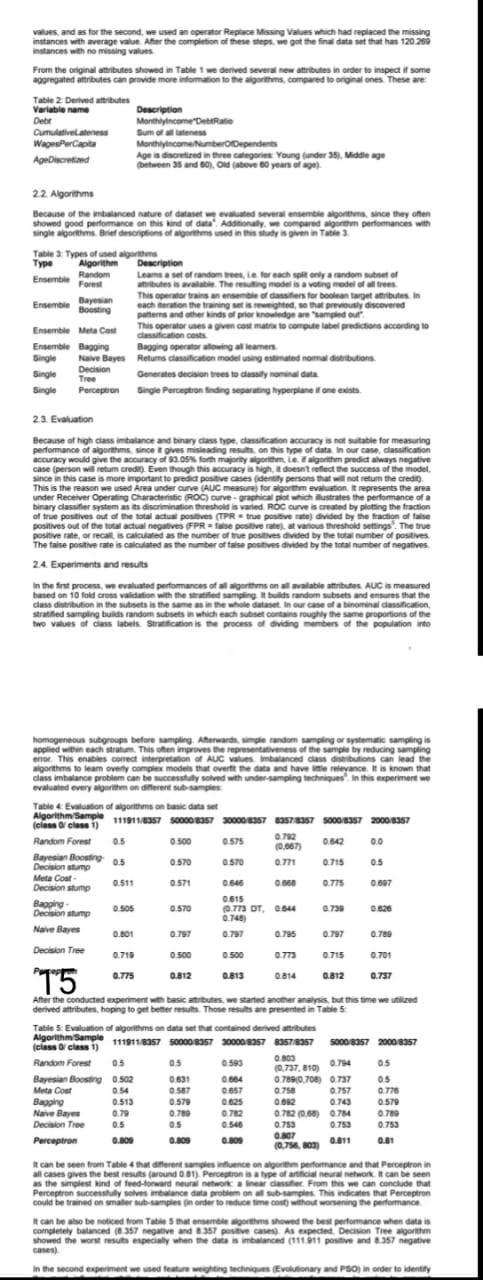
values, and as for the second, we used as to Replace Missing Values which had replaced the missing instances with average valuter the completion of these steps we got the final data that has 120.250 instances with no missing values From the original tributes showed in Table 1 we derived several new tributes in order to inspect it some aggregated attributes can provide more information to the algorithms, compared to original ones. These are Table 2 Derdibutes Variable name Description Der Monthly income Cumulativele Sum of WaperCapita Monthly incomberoependents Alcortid Agus chuired in the categories Young Gunder 35), Middle age dehween 35 und 60). Od ove to years of 9) Ene Random 22. Algorithms Because of the ticed nature of dataset evaluated several ensemble algorithms since they often showed good performance on this kind of data de we compared to performances with single woms Berlions of this sed in this study in Table 3 Table 3 Types of used algorithms Type Algorithm Description Random Learns a set of random refrach it only a random set of Forest atbutes is available. The resulting model is a voting model of trees This operator trains an ensemble of classifiers for boolean target tributes. In Ensemble Bayesian testing each oration the training set sighted, so that previously discovered per and other kinds of prior knowledge areamed out Ensemble Meta Coll de compte el predictions according to operator tes a gran cost matter costs Ensemble Bagging Bagong operator wing alleen Single NaveBoys Returns classification model using estimated normal debutors Decision Single Tree Generes decisions to desily ronil Gula Single Perception Single Perception finding seperting hyperplane one ex 2.3. Evaluation Because of high class imbalance and binary class type, cassation accuracy is not suitable for measuring performance of algorithms since gives misleading on this type of data th our case, dassification accuracy would give the way of 93.05% forth marity grom is igarithm predict always negative case (person will return credit). Even though this accuracy at Nigh, doesn't reflect the success of the model since in this case is more important to predispositive cases identity person that not return the credit This is the reason we used Area under curve (AUC measure for orth evaluation represents the area under Receiver Operating Characteristic ROC curve-graphical plot which istrates the performance of a binary classifier system as its discrimination threshold varied ROC curve is created by plating the traction of the positives out of the total act positives (TPR = true positive divided by the fraction of fase positives out of the total actual negatives FPR se positive at various threshold settings. The true positive rate ofrecall is calculated as the number of the positives divided by the total number of positives The faise positive rate is calculated as the number of faise positive divided by the total number of negatives 24. Experiments and results In the first process, evaluated performances of algorithms on alable attributes AUC is measured hated on 10 fold cross validation with the stratified samping its random sube and ensures that the class distribution in the subsets is the same as in the whole dataset in our case of a binominal classification Stratified samping builds random stises which each substans roughly the same proportions of the two values of class labels Strification is the process of dividing members of the population into homogeneous subgroups before sampling, Awards, mandom sampling or systematic sampling is applied within each strom. This the improves the representatives of the sample by reducing sampling error. This enables Come Werpretation of AUC valuesbalanced class distributions can lead the wgorithms to leam very complex models that overtte date and have intereyance. It is known that class imbalance problem can be successfully solved with under sampling techniques. In this experiment we evaluated every ritm on different subsamples Table & Evaluation of algorithms on basic data Algorithm Band 1119110357 500 BIS 3000357 35718357 S0008557 20008357 class class 1) Random Forest 0.5 0.72 0500 0.575 0.667) 0.542 0.0 Bayesian Boosting Decision sump 0.5 0.570 0570 071 0.715 05 Meta Cour Decision stump 0.511 0571 0.646 0660 0.775 0.007 Baoping 0.615 Decision stup 0.50 0.570 TH DI A 0.730 0.740 0.001 0.797 0.737 0.795 0.797 0.780 Decision Tree 0.710 0.500 0.500 0.715 0.701 0.775 0.812 0.813 0.814 0.812 0.737 Narve Bayes 15 0.794 After the conducted experiment basic but we started or analyses, but this time we wired derived attributes, hoping to get better results. These results are presented in Table 5 Table Evaluation of algorithms on dataset contained durived utes Algorithm Sample class class 11111911.807 0057 20000ROS? 23578057 50008357 20008357 Random Forest 05 05 593 0.003 0.737, 010) 05 Bayesian Boosting 0.502 0.631 0664 0.7890708) 0.737 05 Meta Coor 0.54 587 0657 0.750 0.757 0.770 Bapping 0.513 0.579 0.625 0.743 0.579 NaveBay 0.79 0.780 0.72 0.762 (0.63) 0.784 0.710 Decision Tree 0.5 OS 0.753 0.753 0.753 Perceptron Q.807 0.000 0.00 0.009 10.758, on 0.311 0.01 It can be seen from Table 4th Gerontamente ongorithe performance and that perceptronin all cases gives the best results around 0.01). Perception is a type of artificial neural network. It can be seen as the simplest kind of feed forward neural network area classifier. From this we can conclude that Perceptron successfully solvence data problem on alb-campes This indicates that perceptron could be red on smaler samples in order to reduce time cost without worsening the performance It can be sobe noticed from Tate that morts showed the best performance when dat is completely balanced ( 357 tive and 8 357 positives As expected Decision Tree algorithm showed the worst resus especially when the disa menced (111911 positive and 2.357 megative cases) In the second experiment we used feature weighting techniques Evolutionary and PSO) in order to identifyStep by Step Solution
There are 3 Steps involved in it
1 Expert Approved Answer
Step: 1 Unlock

Question Has Been Solved by an Expert!
Get step-by-step solutions from verified subject matter experts
Step: 2 Unlock
Step: 3 Unlock