

Question: Descriptive Statistics N Mean Std. Deviation Minimum Maximum On a scale of 0-10, how 125 9.87 1.976 1 11 likely are you to attend the
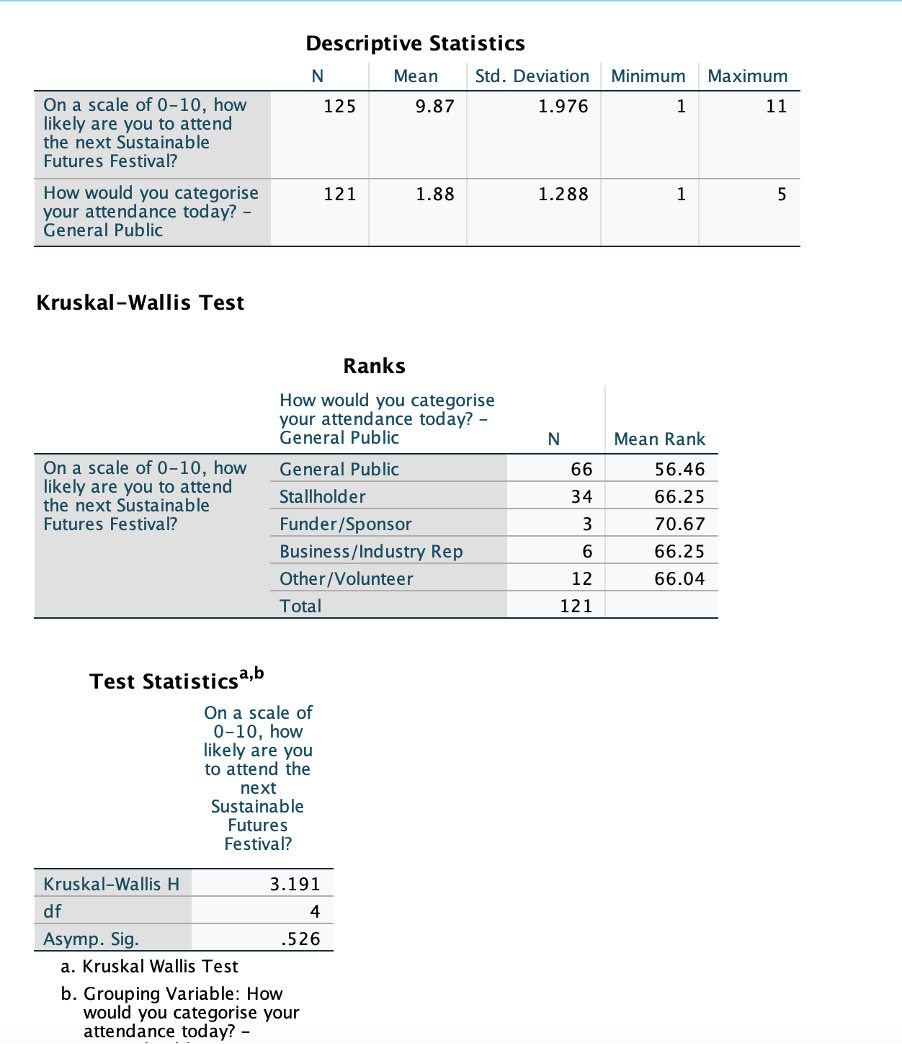
Descriptive Statistics N Mean Std. Deviation Minimum Maximum On a scale of 0-10, how 125 9.87 1.976 1 11 likely are you to attend the next Sustainable Futures Festival? How would you categorise 121 1.88 1.288 1 5 your attendance today? - General Public Kruskal-Wallis Test Ranks How would you categorise your attendance today? - General Public N Mean Rank On a scale of 0-10, how General Public 66 56.46 likely are you to attend Stallholder 34 the next Sustainable 66.25 Futures Festival? Funder/Sponsor 3 70.67 Business/Industry Rep 6 66.25 Other/Volunteer 12 66.04 Total 121 Test Statisticsa,b On a scale of 0-10, how likely are you to attend the next Sustainable Futures Festival? Kruskal-Wallis H 3.191 df Asymp. Sig. 526 a. Kruskal Wallis Test b. Grouping Variable: How would you categorise your attendance today
Step by Step Solution
There are 3 Steps involved in it

Get step-by-step solutions from verified subject matter experts