

Question: Descriptive Statistics: Sample Size Mean Std. Dev. Min. Q1 Median Q3 Max. IQR 30 165 28.7 113 148 170 184 237 36 Histogram 6- 5-
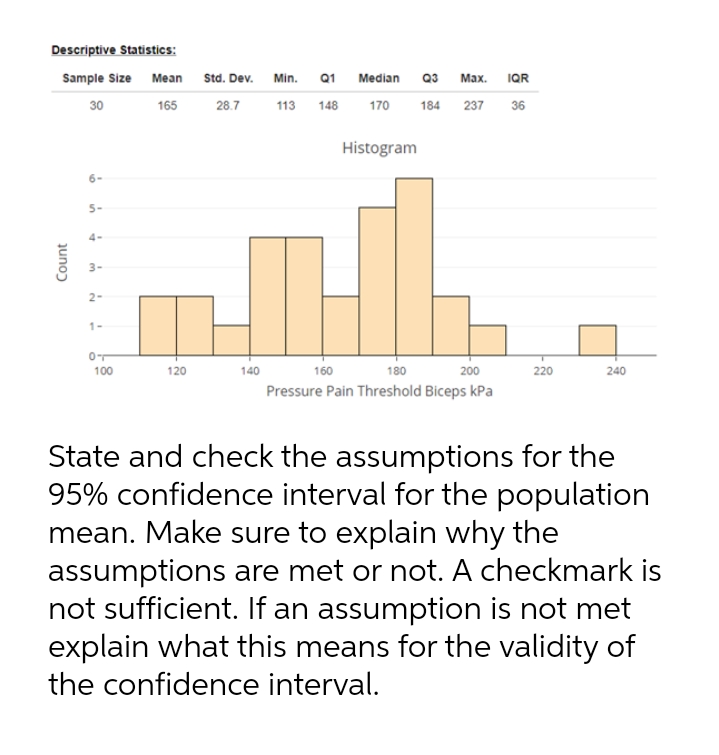

Descriptive Statistics: Sample Size Mean Std. Dev. Min. Q1 Median Q3 Max. IQR 30 165 28.7 113 148 170 184 237 36 Histogram 6- 5- 4- Count 3- 2 - 1- 0- 100 120 140 160 180 200 220 240 Pressure Pain Threshold Biceps kPa State and check the assumptions for the 95% confidence interval for the population mean. Make sure to explain why the assumptions are met or not. A checkmark is not sufficient. If an assumption is not met explain what this means for the validity of the confidence interval
Step by Step Solution
There are 3 Steps involved in it
1 Expert Approved Answer
Step: 1 Unlock

Question Has Been Solved by an Expert!
Get step-by-step solutions from verified subject matter experts
Step: 2 Unlock
Step: 3 Unlock