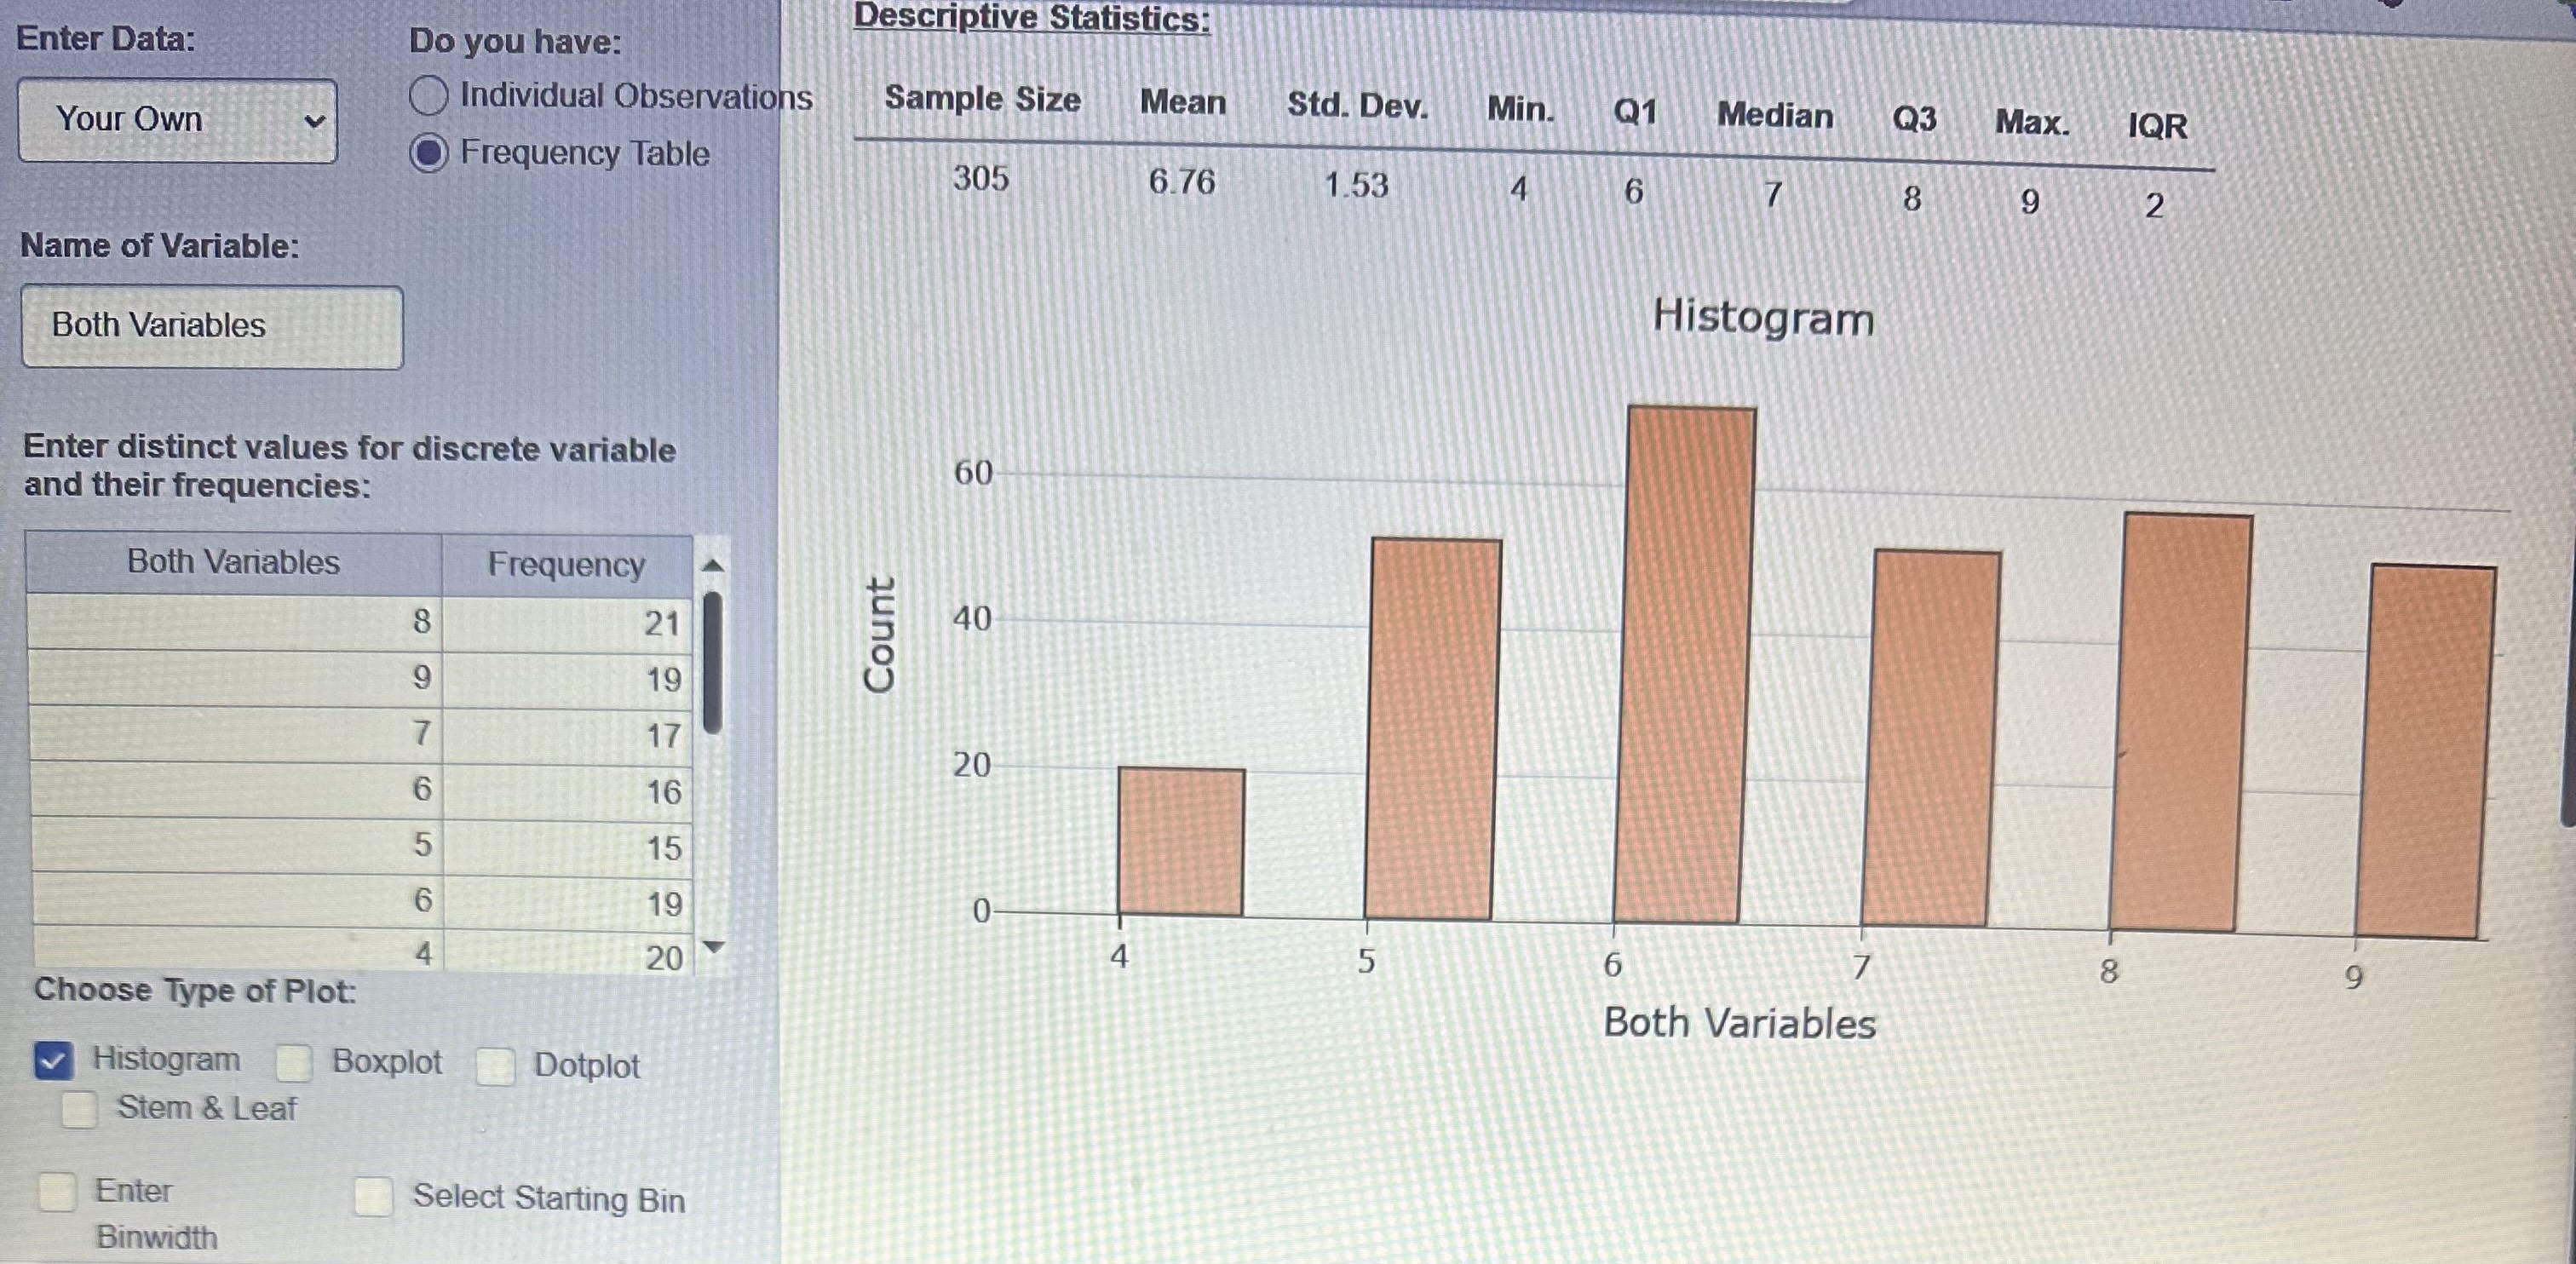
Question: Descriptive Statistics: Enter Data: Do you have: Individual Observations Sample Size Mean Std. Dev. Min. Q1 Median Q3 Your Own Max. IQR Frequency Table 305

Descriptive Statistics: Enter Data: Do you have:Descriptive Statistics: Enter Data: Do you have:
Descriptive Statistics: Enter Data: Do you have: Individual Observations Sample Size Mean Std. Dev. Min. Q1 Median Q3 Your Own Max. IQR Frequency Table 305 6.76 1.53 6 8 9 2 Name of Variable: Both Variables Histogram Enter distinct values for discrete variable 60 and their frequencies: Both Variables Frequency 8 21 40 Count 9 19 7 17 20 6 16 5 15 6 19 4 20 4 5 6 8 9 Choose Type of Plot: Both Variables Histogram Boxplot Dotplot Stem & Leaf Enter Select Starting Bin BinwidthDescriptive Statistics: Enter Data: Do you have: Individual Observations Sample Size Mean Std. Dev. Min. Your Own Q1 Median Q3 Max. IQR Frequency Table 34 12.35 5.96 4 7 12 18 22 11 Name of Variable: Sort Values: Both Variables O No O Yes Histogram Enter observations (separated by space) or 6 copy and paste from spreadsheet: 6 19 8 22 4 Count Choose Type of Plot: 2 Histogram Boxplot Dotplot Stem & Leaf Select Binwidth For Histogram: 10 15 20 0.5 2 9 Both Variables 0.5 14 22 3.1 3.9 48 5.7 6.5 7.4 8.2 9

Step by Step Solution

There are 3 Steps involved in it

1 Expert Approved Answer
Step: 1 Unlock blur-text-image
Question Has Been Solved by an Expert!

Get step-by-step solutions from verified subject matter experts

Step: 2 Unlock
Step: 3 Unlock

Students Have Also Explored These Related Mathematics Questions!