

Question: Womens Systolic BP Sample #2 Sample Size Mean Std. Dev. Min. Q1 Median Q3 Max. IQR 60 118 17 84 106 116 124 160 17.5
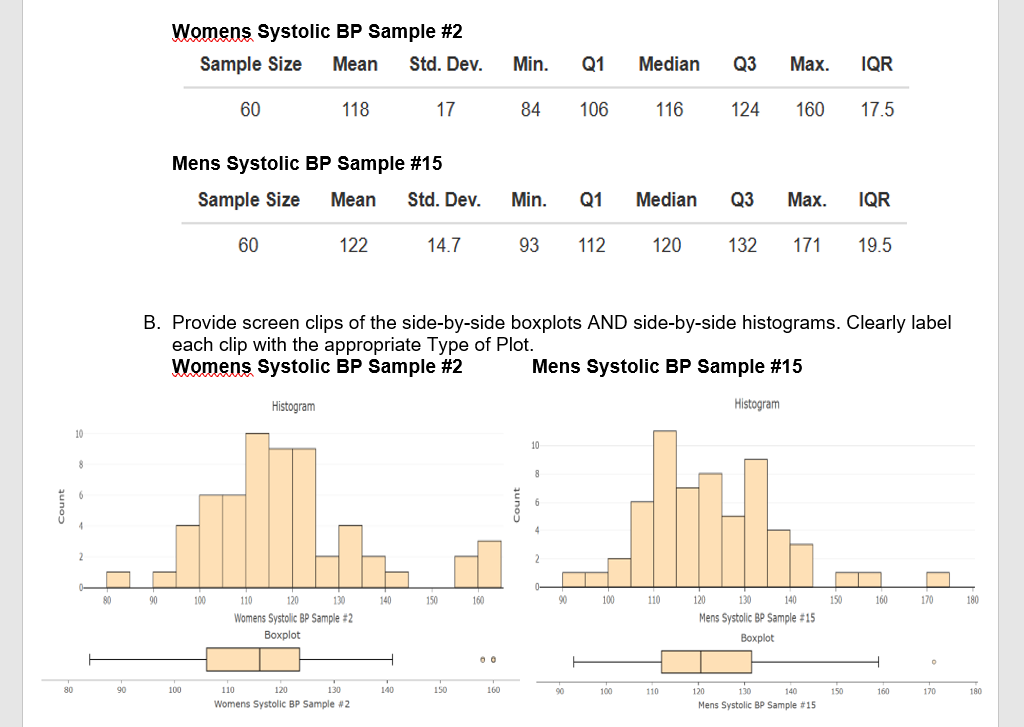
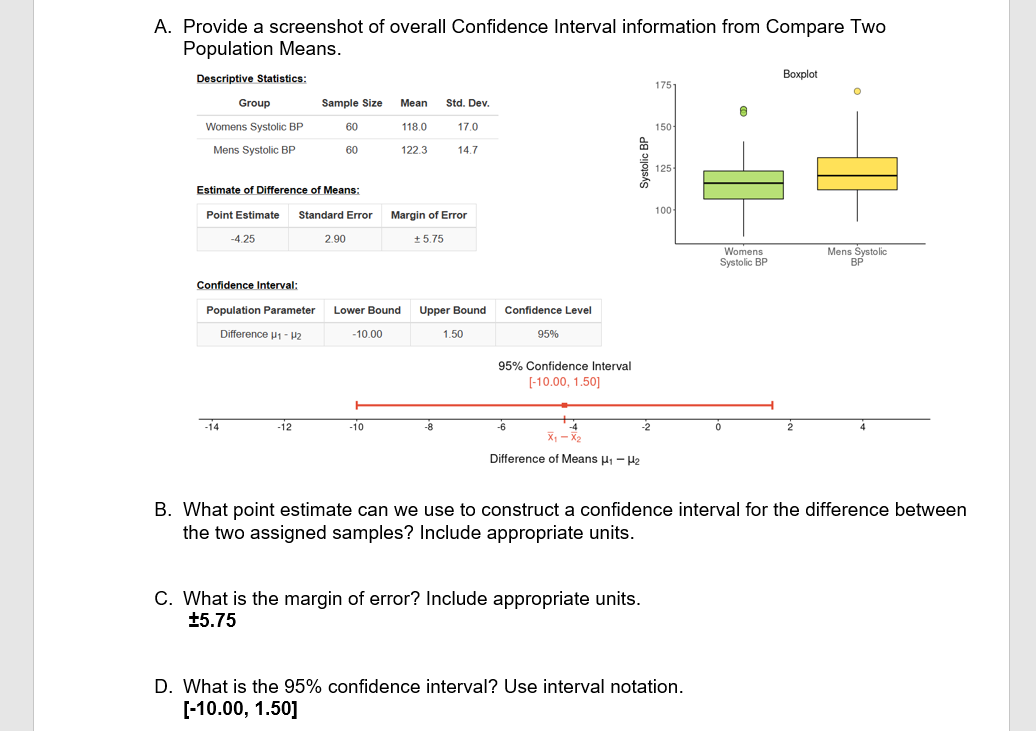
Womens Systolic BP Sample #2 Sample Size Mean Std. Dev. Min. Q1 Median Q3 Max. IQR 60 118 17 84 106 116 124 160 17.5 Mens Systolic BP Sample #15 Sample Size Mean Std. Dev. Min. Q1 Median Q3 Max. IQR 60 122 14.7 93 112 120 132 171 19.5 B. Provide screen clips of the side-by-side boxplots AND side-by-side histograms. Clearly label each clip with the appropriate Type of Plot. Womens Systolic BP Sample #2 Mens Systolic BP Sample #15 Histogram Histogram Count Count 80 90 100 110 120 130 140 150 160 90 100 110 120 130 140 150 160 170 180 Womens Systolic BP Sample #2 Mens Systolic BP Sample #15 Boxplot Boxplot 80 90 100 110 120 130 140 150 160 90 100 110 120 130 140 150 160 170 180 Womens Systolic BP Sample #2 Mens Systolic BP Sample #15A. Provide a screenshot of overall Confidence Interval information from Compare Two Population Means. Descriptive Statistics: Boxplot 175 Group Sample Size Mean Std. Dev. Womens Systolic BP 60 118.0 17.0 150 Mens Systolic BP 60 122.3 14.7 Systolic BP 125 Estimate of Difference of Means: Point Estimate Standard Error Margin of Error 100 -4.25 2.90 $ 5.75 Womens Mens Systolic Systolic BP BP Confidence Interval: Population Parameter Lower Bound Upper Bound Confidence Level Difference H1 - H2 -10.00 1.50 95% 95% Confidence Interval [-10.00, 1.50] -14 -12 -10 X 1 - X2 Difference of Means M1 - H2 B. What point estimate can we use to construct a confidence interval for the difference between the two assigned samples? Include appropriate units. C. What is the margin of error? Include appropriate units. $5.75 D. What is the 95% confidence interval? Use interval notation. [-10.00, 1.50]E. In 1-2 sentences, interpret the condence interval in context of the application, using appropriate units. F. Further Interpretation: Is the value zero contained in your condence interval (Yes or No}? Using the presence or absence of zero in your confidence interval, explain whether you think there is a significant difference between the population means of women's and men's systolic blood pressures. Explain in 1-2 sentences. Develop a hypothesis about your population means. A. Write a sentence describing your developed hypothesis about the two population means. (Exampie: t hypothesize that the mean househoid income in 2020 was higher than the mean househotd income in 2016.) B. Explain what the symbols #1 and #2 OR pd represent in context. C. Write the null hypothesis in symbols. D. Write the alternative hypothesis in symbols. E. Is your hypothesis test one-tailed or two-tailed? 6. Conduct your hypothesis test at a level of significance 5%, a = 0.05. (Hint: Consider using the Compare Two Population Means ShinyApp https://dcmathpathways.shinyapps.io/2sample_mean/) A. Provide a screenshot of overall Significance Test information from Compare Two Population Means. B. What is your test statistic? C. What is your p-value? D. What is your conclusion about the null hypothesis? Provide specific values used for interpretation. E. In 1-2 sentences, write the conclusion of your hypothesis test in context of the application, using correct units
Step by Step Solution
There are 3 Steps involved in it

Get step-by-step solutions from verified subject matter experts