

Question: Descriptives Std. Statistic Error ToBus Mean 9025 05494 ToBus 95% Confidence Lower 7937 Interval for Mean Bound Upper 1.0113 Bound 5% Trimmed Mean 8889 Median


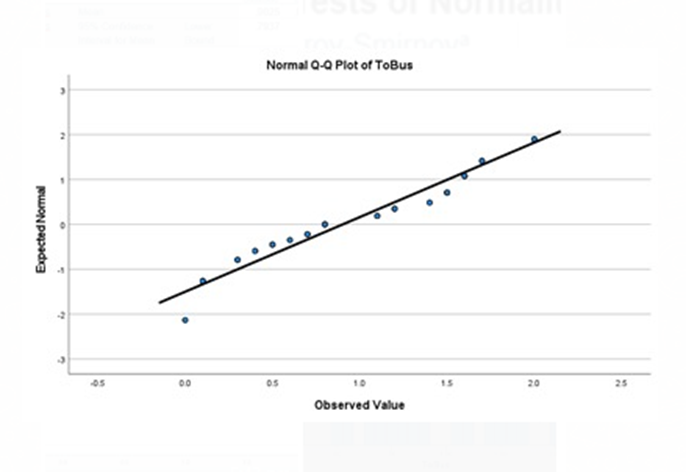


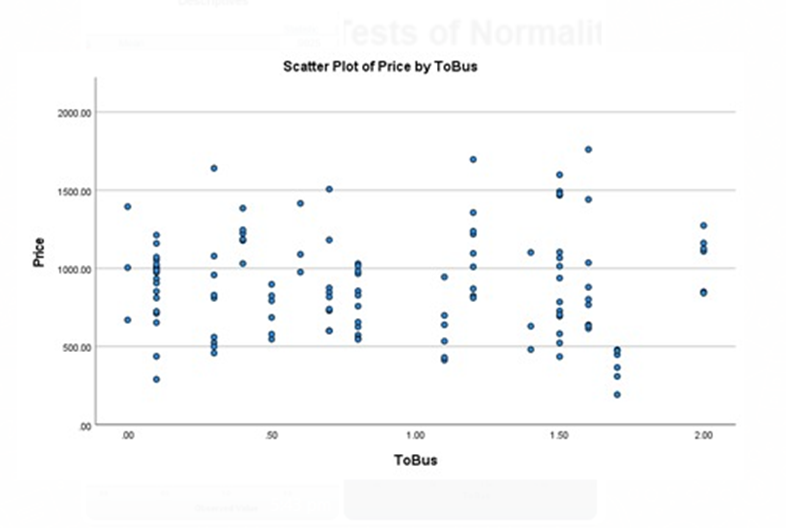
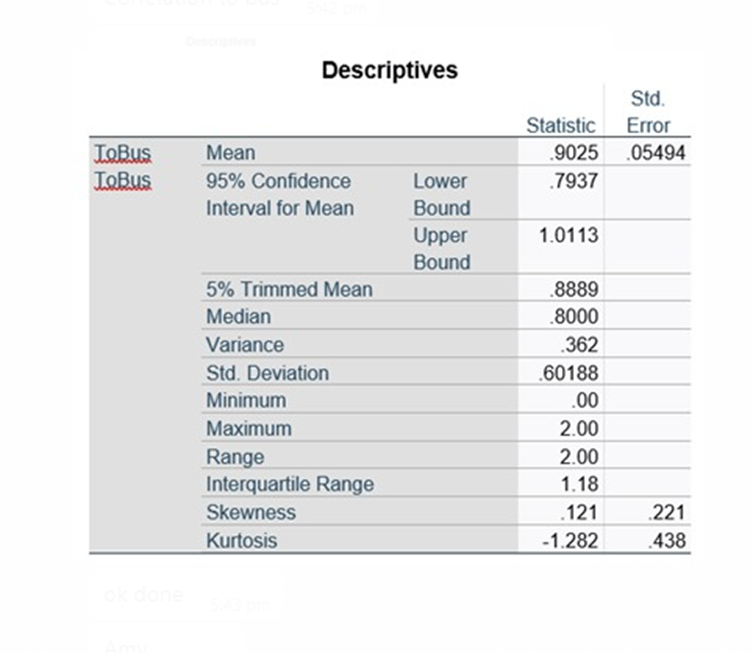

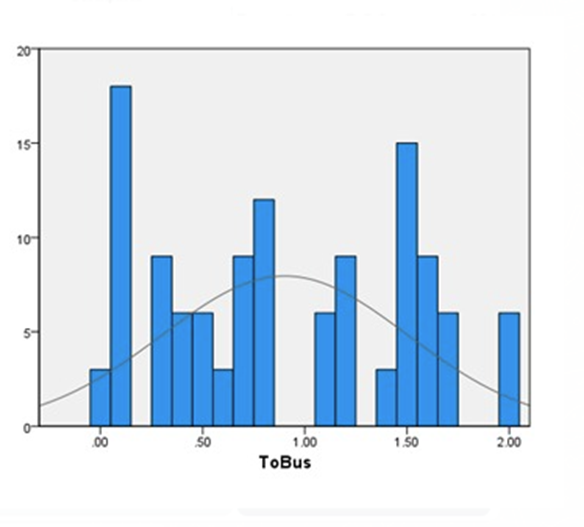
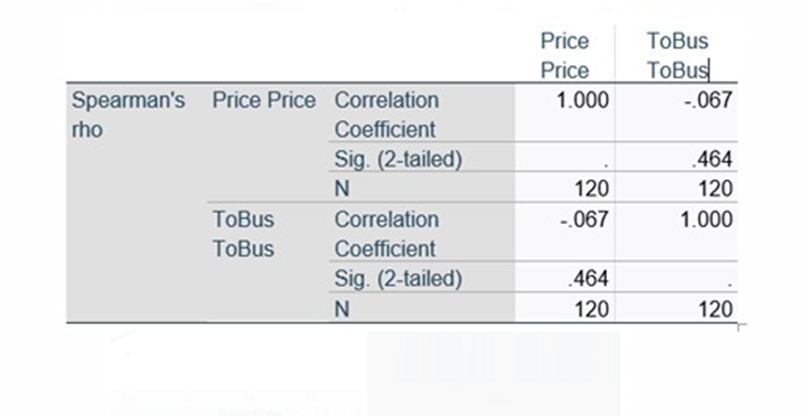

Descriptives Std. Statistic Error ToBus Mean 9025 05494 ToBus 95% Confidence Lower 7937 Interval for Mean Bound Upper 1.0113 Bound 5% Trimmed Mean 8889 Median 8000 Variance 362 Std. Deviation 60188 Minimum 00 Maximum 2.00 Range 2.00 Interquartile Range 1.18 Skewness 121 .221 Kurtosis -1.282 .438 ok done\fNormal Q-Q Plot of ToBus Expected Normal 10 20 25 Observed Value\fPrice ToBus Price ToBus Spearman's Price Price Correlation 1.000 -.067 rho Coefficient Sig. (2-tailed) 464 N 120 120 ToBus Correlation -.067 1.000 ToBus Coefficient Sig. (2-tailed) 464 N 120 120e Scatter Plot of Price by ToBus 2000 00 1900 60 OD Price 1600 60 00 60 030 . .. 190 500 00 00 50 1.00 1.50 200 ToBus
Step by Step Solution
There are 3 Steps involved in it

Get step-by-step solutions from verified subject matter experts