

Question: Design the following filters on MATLAB and attach code along with magnitude response and phase plot of each designed filter in your report. Note: Use
Design the following filters on MATLAB and attach code along with magnitude response and phase plot of each designed filter in your report. Note: Use of MATLAB filter design tool is not allowed.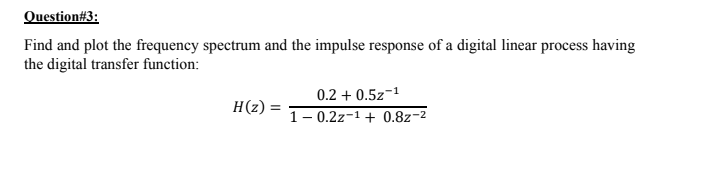
Find and plot the frequency spectrum and the impulse response of a digital linear process having the digital transfer function: H(z)=10.2z1+0.8z20.2+0.5z1
Step by Step Solution
There are 3 Steps involved in it
1 Expert Approved Answer
Step: 1 Unlock

Question Has Been Solved by an Expert!
Get step-by-step solutions from verified subject matter experts
Step: 2 Unlock
Step: 3 Unlock