

Question: Detect skin regions in images, specifically: - Implement iterative k-means, as described below, and leave k (number of clusters) as an open parameter to be
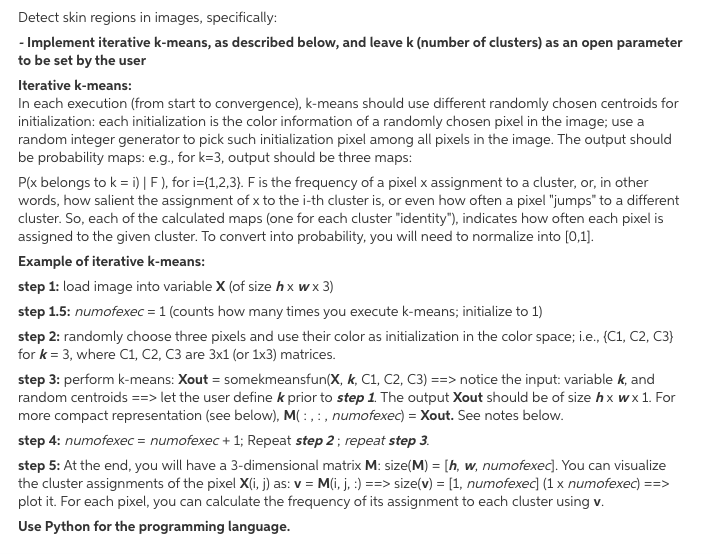
Detect skin regions in images, specifically: - Implement iterative k-means, as described below, and leave k (number of clusters) as an open parameter to be set by the user Iterative k-means: In each execution (from start to convergence), k-means should use different randomly chosen centroids for initialization: each initialization is the color information of a randomly chosen pixel in the image; use a random integer generator to pick such initialization pixel among all pixels in the image. The output should be probability maps: e.g., for k=3, output should be three maps: Plx belongs to k = i) | F), for i={1,2,3). F is the frequency of a pixel x assignment to a cluster, or, in other words, how salient the assignment of x to the i-th cluster is, or even how often a pixel "jumps" to a different cluster. So, each of the calculated maps (one for each cluster "identity"), indicates how often each pixel is assigned to the given cluster. To convert into probability, you will need to normalize into [0,1]. Example of iterative k-means: step 1: load image into variable X (of size hx wx 3) step 1.5: numofexec = 1 (counts how many times you execute k-means; initialize to 1) step 2: randomly choose three pixels and use their color as initialization in the color space; i.e., (C1, C2, C3} for k= 3, where C1, C2, C3 are 3x1 (or 1x3) matrices. step 3: perform k-means: Xout = somekmeansfun(X, K, C1, C2, C3) ==> notice the input: variable k, and random centroids ==> let the user define k prior to step 1. The output Xout should be of size hx wx 1. For more compact representation (see below), M(:,:, numofexec) = Xout. See notes below. step 4: numofexec = numofexec + 1; Repeat step 2 ; repeat step 3. step 5: At the end, you will have a 3-dimensional matrix M: size(M) = [h, w, numofexec]. You can visualize the cluster assignments of the pixel X(i, j) as: v = M(i, j, :) ==> size(v) = [1, numofexec] (1 x numofexec) ==> plot it. For each pixel, you can calculate the frequency of its assignment to each cluster using v. Use Python for the programming language. Detect skin regions in images, specifically: - Implement iterative k-means, as described below, and leave k (number of clusters) as an open parameter to be set by the user Iterative k-means: In each execution (from start to convergence), k-means should use different randomly chosen centroids for initialization: each initialization is the color information of a randomly chosen pixel in the image; use a random integer generator to pick such initialization pixel among all pixels in the image. The output should be probability maps: e.g., for k=3, output should be three maps: Plx belongs to k = i) | F), for i={1,2,3). F is the frequency of a pixel x assignment to a cluster, or, in other words, how salient the assignment of x to the i-th cluster is, or even how often a pixel "jumps" to a different cluster. So, each of the calculated maps (one for each cluster "identity"), indicates how often each pixel is assigned to the given cluster. To convert into probability, you will need to normalize into [0,1]. Example of iterative k-means: step 1: load image into variable X (of size hx wx 3) step 1.5: numofexec = 1 (counts how many times you execute k-means; initialize to 1) step 2: randomly choose three pixels and use their color as initialization in the color space; i.e., (C1, C2, C3} for k= 3, where C1, C2, C3 are 3x1 (or 1x3) matrices. step 3: perform k-means: Xout = somekmeansfun(X, K, C1, C2, C3) ==> notice the input: variable k, and random centroids ==> let the user define k prior to step 1. The output Xout should be of size hx wx 1. For more compact representation (see below), M(:,:, numofexec) = Xout. See notes below. step 4: numofexec = numofexec + 1; Repeat step 2 ; repeat step 3. step 5: At the end, you will have a 3-dimensional matrix M: size(M) = [h, w, numofexec]. You can visualize the cluster assignments of the pixel X(i, j) as: v = M(i, j, :) ==> size(v) = [1, numofexec] (1 x numofexec) ==> plot it. For each pixel, you can calculate the frequency of its assignment to each cluster using v. Use Python for the programming language
Step by Step Solution
There are 3 Steps involved in it

Get step-by-step solutions from verified subject matter experts