Question: Determine the optimal ordering quantity for each warehouse (KOLKATA and VIZAG) and the related inventory costs. (submit excel sheets like below or similar). Data Annual
Determine the optimal ordering quantity for each warehouse (KOLKATA and VIZAG) and the related inventory costs. (submit excel sheets like below or similar).
| Data | |
| Annual demand, D | ? |
| Setup/order cost, f | ? |
| Holding cost, c | ? |
| Unit cost, p | ? |
| Daily demand rate, d | ? |
| Lead time in days, L | |
| | |
| Results | |
| Optimal Order Quantity, q* | ? |
| Maximum Inventory | ? |
| Average Inventory | ? |
| Number of Orders | ? |
| | |
| Holding cost | ? |
| Setup cost | ? |
| | |
| Unit costs | ? |
| Total cost, Tc | ? |
| Reorder Point | ? |
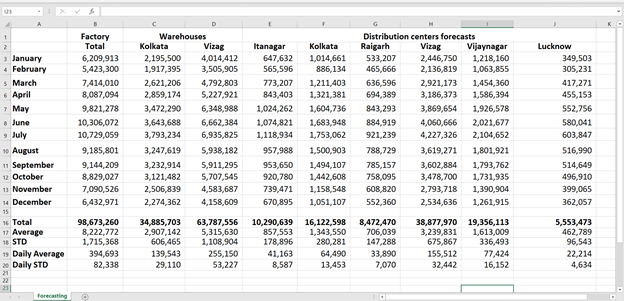
Solve based on the demand forecasting provided in the given below Excel spreadsheet.
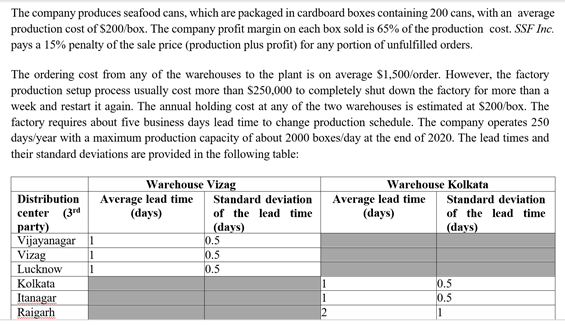
The company produces seafood cans, which are packaged in cardboard boxes containing 200 cans, with an average production cost of S200/box. The company profit margin on each box sold is 65% of the production cost. SSF Inc. pays a 15% penalty of the sale price (production plus profit) for any portion of unfulfilled orders. The ordering cost from any of the warehouses to the plant is on average $1,500/order. However, the factory production setup process usually cost more than $250,000 to completely shut down the factory for more than a week and restart it again. The annual holding cost at any of the two warehouses is estimated at $200/box. The factory requires about five business days lead time to change production schedule. The company operates 250 days/year with a maximum production capacity of about 2000 boxes/day at the end of 2020. The lead times and their standard deviations are provided in the following table: Warehouse Kolkata Average lead time Standard deviation (days) of the lead time (days) Warehouse Vizag Distribution Average lead time Standard deviation center (3rd (days) of the lead time party) (days) Vijayanagar 1 0.5 Vizag 0.5 Lucknow 0.5 Kolkata 1 Itanagar 1 Raigarh 2 0.5 0.5 1 2 January 4 February 5 March 6 April 7 May 8 June July 10 August 11 September 12 October 13 November 14 December 15 Total 17 Average 18 STD 19 Daily Average 2. Daily STD 21 Factory Total 6,209,913 5,423,300 7,414,010 8,087,094 9,821,278 10,306,072 10,729,059 9,185,801 9,144,209 8,829,027 7,090,526 6,432,971 Warehouses Kolkata Vizag 2,195,500 4,014,412 1,917,395 3,505,905 2,621,206 4,792,803 2,859,174 5,227,921 3,472,290 6,348,988 3,643,688 6,662,384 3,793,234 6,935,825 3,247,619 5,938,182 3,232,914 5,911,295 3,121,482 5,707,545 2,506,839 4,583,687 2,274,362 4,158,609 Itanagar 647,632 565,596 773,207 843,403 1,024.262 1,074,821 1,118,934 957,988 953,650 920,780 739,471 670,895 Kolkata 1,014,661 886,134 1,211,403 1,321,381 1,604,736 1,683,948 1,753,062 1,500,903 1,494,107 1,442,608 1,158,548 1,051,107 Distribution centers forecasts Raigarh Vizag Vijaynagar 533,207 2,446,750 1,218,160 465,666 2,136,819 1,063,855 636,596 2,921,173 1,454,360 694,389 3,186,373 1,586,394 843,293 3,869,654 1,926,578 884,919 4,060,666 2,021,677 921,239 4,227,326 2,104,652 788,729 3,619,271 1,801,921 785,157 3,602,884 1,793,762 758,095 3,478,700 1,731,935 608,820 2,793,718 1,390,904 552,360 2,534,636 1,261,915 Lucknow 349,503 305,231 417,271 455,153 552,756 580,041 603,847 516,990 514,649 496,910 399,065 362,057 98,673,260 8,222,772 1,715,368 394,693 82,338 34,885,703 2,907,142 606,465 139,543 29.110 63,787,556 5,315,630 1,108,904 255,150 53,227 10,290,639 857,553 178,896 41,163 8,587 16,122,598 1,343,550 280,281 64,490 13,453 8,472,470 706,039 147,288 33,890 7,070 38,877,970 19,356,113 3,239,831 1,613,009 675,867 336,493 155,512 77.424 32,442 16,152 5,553,473 462,789 96,543 22,214 4,634 231 Forecasting The company produces seafood cans, which are packaged in cardboard boxes containing 200 cans, with an average production cost of S200/box. The company profit margin on each box sold is 65% of the production cost. SSF Inc. pays a 15% penalty of the sale price (production plus profit) for any portion of unfulfilled orders. The ordering cost from any of the warehouses to the plant is on average $1,500/order. However, the factory production setup process usually cost more than $250,000 to completely shut down the factory for more than a week and restart it again. The annual holding cost at any of the two warehouses is estimated at $200/box. The factory requires about five business days lead time to change production schedule. The company operates 250 days/year with a maximum production capacity of about 2000 boxes/day at the end of 2020. The lead times and their standard deviations are provided in the following table: Warehouse Kolkata Average lead time Standard deviation (days) of the lead time (days) Warehouse Vizag Distribution Average lead time Standard deviation center (3rd (days) of the lead time party) (days) Vijayanagar 1 0.5 Vizag 0.5 Lucknow 0.5 Kolkata 1 Itanagar 1 Raigarh 2 0.5 0.5 1 2 January 4 February 5 March 6 April 7 May 8 June July 10 August 11 September 12 October 13 November 14 December 15 Total 17 Average 18 STD 19 Daily Average 2. Daily STD 21 Factory Total 6,209,913 5,423,300 7,414,010 8,087,094 9,821,278 10,306,072 10,729,059 9,185,801 9,144,209 8,829,027 7,090,526 6,432,971 Warehouses Kolkata Vizag 2,195,500 4,014,412 1,917,395 3,505,905 2,621,206 4,792,803 2,859,174 5,227,921 3,472,290 6,348,988 3,643,688 6,662,384 3,793,234 6,935,825 3,247,619 5,938,182 3,232,914 5,911,295 3,121,482 5,707,545 2,506,839 4,583,687 2,274,362 4,158,609 Itanagar 647,632 565,596 773,207 843,403 1,024.262 1,074,821 1,118,934 957,988 953,650 920,780 739,471 670,895 Kolkata 1,014,661 886,134 1,211,403 1,321,381 1,604,736 1,683,948 1,753,062 1,500,903 1,494,107 1,442,608 1,158,548 1,051,107 Distribution centers forecasts Raigarh Vizag Vijaynagar 533,207 2,446,750 1,218,160 465,666 2,136,819 1,063,855 636,596 2,921,173 1,454,360 694,389 3,186,373 1,586,394 843,293 3,869,654 1,926,578 884,919 4,060,666 2,021,677 921,239 4,227,326 2,104,652 788,729 3,619,271 1,801,921 785,157 3,602,884 1,793,762 758,095 3,478,700 1,731,935 608,820 2,793,718 1,390,904 552,360 2,534,636 1,261,915 Lucknow 349,503 305,231 417,271 455,153 552,756 580,041 603,847 516,990 514,649 496,910 399,065 362,057 98,673,260 8,222,772 1,715,368 394,693 82,338 34,885,703 2,907,142 606,465 139,543 29.110 63,787,556 5,315,630 1,108,904 255,150 53,227 10,290,639 857,553 178,896 41,163 8,587 16,122,598 1,343,550 280,281 64,490 13,453 8,472,470 706,039 147,288 33,890 7,070 38,877,970 19,356,113 3,239,831 1,613,009 675,867 336,493 155,512 77.424 32,442 16,152 5,553,473 462,789 96,543 22,214 4,634 231 Forecasting


