

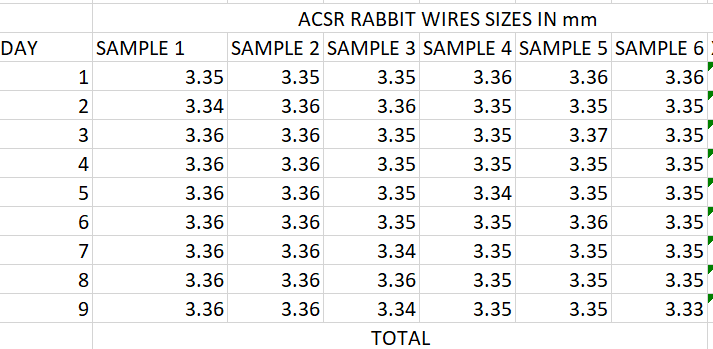
Question: DETERMINE THE UPPER AND LOWER CONTROL LIMITS AND THE OVERALL MEANS FOR X CHARS AND R CHARTS?Draw charts x and r charts in excel in
DETERMINE THE UPPER AND LOWER CONTROL LIMITS AND THE OVERALL MEANS FOR X CHARS AND R CHARTS?Draw charts x and r charts in excel in complete steps?Also tell how to drawn in excel?Does the data indicate process in control or not ?
Step by Step Solution
There are 3 Steps involved in it
1 Expert Approved Answer
Step: 1 Unlock

Question Has Been Solved by an Expert!
Get step-by-step solutions from verified subject matter experts
Step: 2 Unlock
Step: 3 Unlock