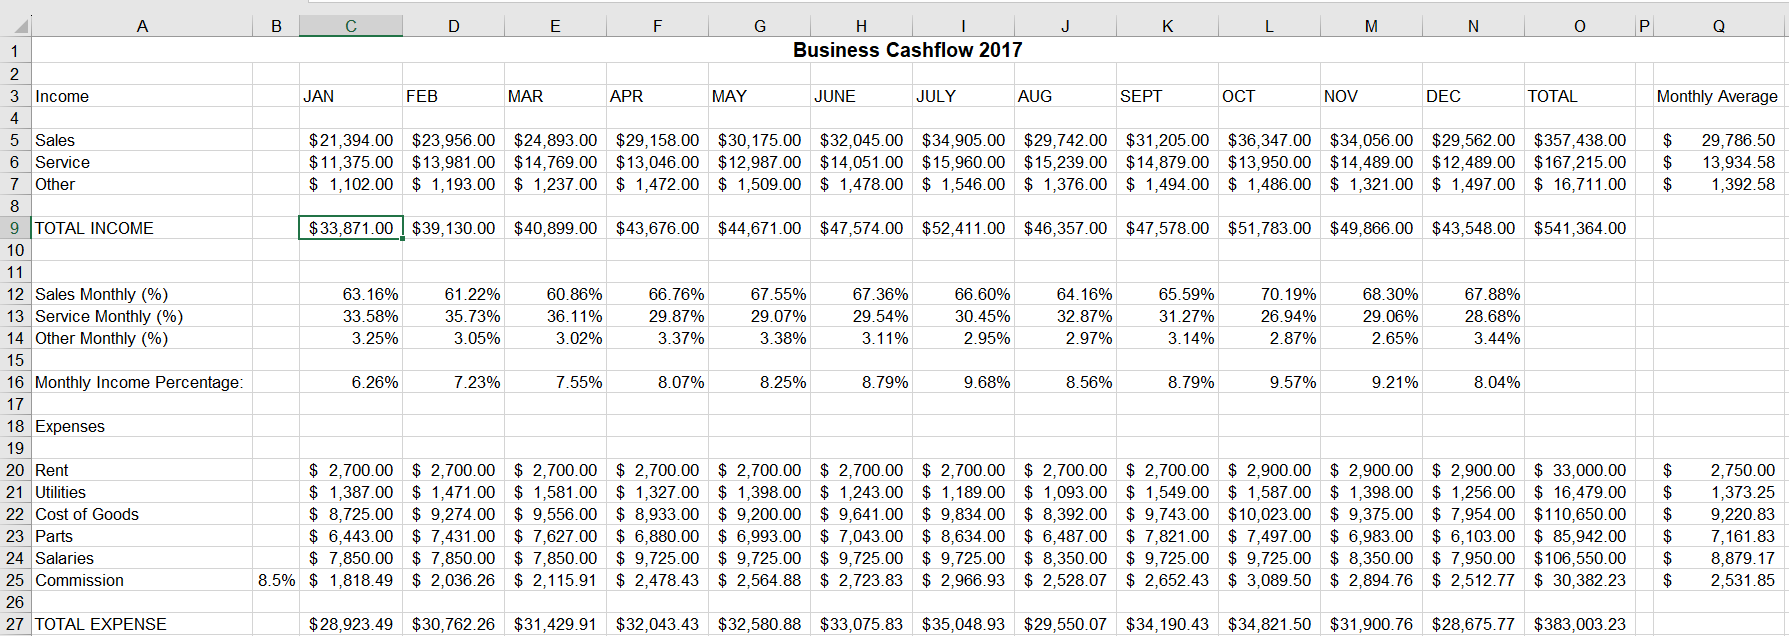
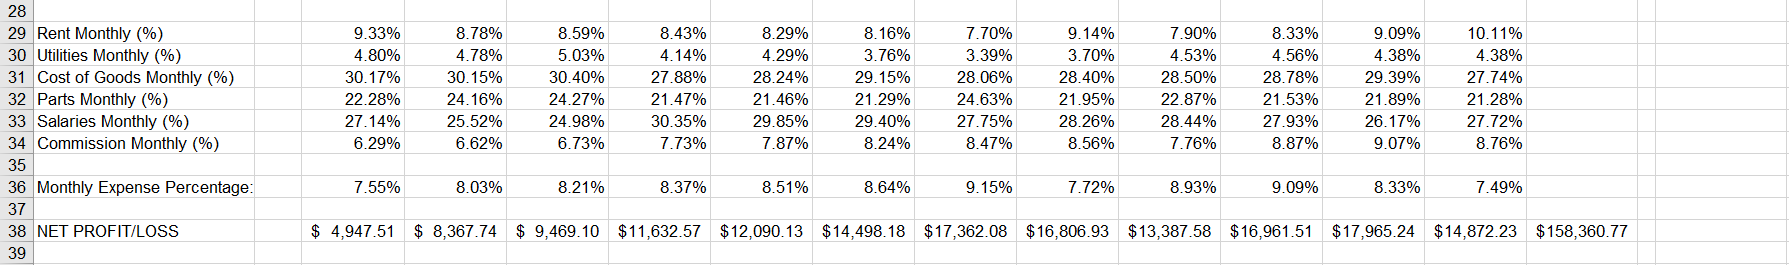
Question: Determine what statistical analysis formulas you need. Perform these tasks on the 17 Cash flow worksheet. For example, calculate the monthly averages and monthly percentages

  1. Determine what statistical analysis formulas you need. Perform these tasks on the 17 Cash flow worksheet. For example, calculate the monthly averages and monthly percentages of the line totals. Use this information to create the scenarios you need to use the goal-seek tools. For example, JAN total income was 6.26% of the 2017 Cash flow. So, if the goal for 2018 is to have 6.26% of the year's budget total of $624,000, then JAN 2018 income categories (Sales, Service and Other) need to total $39,041. What combination of category numbers will achieve that? Use Excel's Scenario Manager and goal seek tools to project how to attain these objectives for the 2018 Budget worksheet. You have to show your work on the Cash flow worksheet or on a new worksheet named Scenario Manager that is produced with the tools you use.
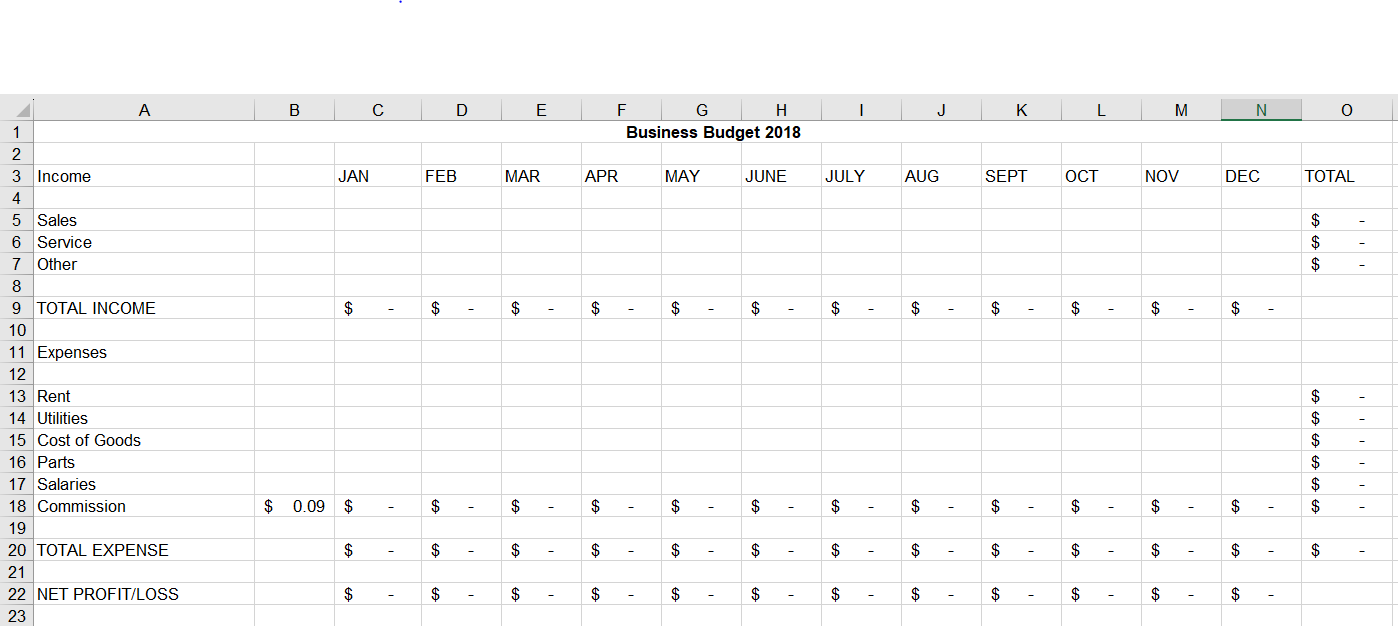
  2. Complete the following on next year budget worksheet (2018):
    1. TOTAL Income for each category (Sales, Service and Other) needs to be budgeted so that the Total Income for the year is $624,000, but you have to base this result on What Ifs for all 3 categories (Sales, Service and Other).
    2. Under EXPENSES, please note that Rent will be fixed at $2900, until October 2017, when it will increase to $3100 for 2018. Also notice that Commission is calculated based the percent in B18 and the current month's Sales, so it should not be changed. Keeping these factors in mind, we want our Expenses to reflect a Total of $456,000 for the 2018 Budget. Thus, the only cells that will change from testing your Expense Scenarios are Utilities, Cost of Goods, Parts and Salaries.
    3. Note: Use your problem-solving skills and the Excel tools you have studied to help you prepare the proposed 2018 Budget. There is no one correct answer but there are reasonable answers. Students need to show their work and calculations.

Determine what statistical analysis formulas youDetermine what statistical analysis formulas youDetermine what statistical analysis formulas you
A B C D E F G H J K M N O P Business Cashflow 2017 N - Income JAN FEB MAR APR MAY JUNE JULY AUG SEPT OCT NOV DEC TOTAL Monthly Average Sales $ 21,394.00 $23,956.00 $24,893.00 $29,158.00 $30, 175.00 $32,045.00 $34,905.00 $29,742.00 $31,205.00 $36,347.00 $34,056.00 $29,562.00 $357,438.00 $ 29,786.50 6 Service $ 11,375.00 $13,981.00 $14,769.00 $13,046.00 $12,987.00 $14,051.00 $15,960.00 $15,239.00 $14,879.00 $13,950.00 $14,489.00 $12,489.00 $167,215.00 13,934.58 7 Other $ 1, 102.00 $ 1, 193.00 $ 1,237.00 $ 1,472.00 $ 1,509.00 $ 1,478.00 $ 1,546.00 $ 1,376.00 $ 1,494.00 $ 1,486.00 $ 1,321.00 $ 1,497.00 $ 16,711.00 1,392.58 8 9 TOTAL INCOME $ 33,871.00 $39, 130.00 $40,899.00 $43,676.00 $44,671.00 $47,574.00 $52,411.00 $46,357.00 $47,578.00 $51,783.00 $49,866.00 $43,548.00 $541,364.00 10 11 12 Sales Monthly (%) 63. 16% 61.22% 60.86% 66.76% 67.55% 67.36% 66.60% 64.16% 65.59% 70. 19% 68.30% 67.88% 13 Service Monthly (%) 33.58% 35.73% 36.11% 29.87% 29.07% 29.54% 30.45% 32.87% 31.27% 26.94% 29.06% 28.68% 14 Other Monthly (%) 3.25% 3.05% 3.02% 3.37% 3.38% 3.11% 2.95% 2.97% 3.14% 2.87% 2.65% 3.44% 15 16 Monthly Income Percentage: 6.26% 7.23% 7.55% 8.07% 8.25% 8.79% 9.68% 8.56% 8.79% 9.57% 9.21% 8.04% 17 18 Expenses 19 20 Rent $ 2,700.00 $ 2,700.00 $ 2,700.00 $ 2,700.00 $ 2,700.00 $ 2,700.00 $ 2,700.00 $ 2,700.00 $ 2,700.00 $ 2,900.00 $ 2,900.00 $ 2,900.00 $ 33,000.00 2,750.00 21 Utilities $ 1,387.00 $ 1,471.00 $ 1,581.00 $ 1,327.00 $ 1,398.00 $ 1,243.00 $ 1, 189.00 $ 1,093.00 $ 1,549.00 $ 1,587.00 $ 1,398.00 $ 1,256.00 $ 16,479.00 1,373.25 22 Cost of Goods $ 8,725.00 $ 9,274.00 $ 9,556.00 $ 8,933.00 $ 9,200.00 $ 9,641.00 $ 9,834.00 $ 8,392.00 $ 9,743.00 $10,023.00 $ 9,375.00 $ 7,954.00 $110,650.00 9,220.83 23 Parts $ 6,443.00 $ 7,431.00 $ 7,627.00 $ 6,880.00 $ 6,993.00 $ 7,043.00 $ 8,634.00 $ 6,487.00 $ 7,821.00 $ 7,497.00 $ 6,983.00 $ 6, 103.00 $ 85,942.00 7, 161.83 24 Salaries $ 7,850.00 $ 7,850.00 $ 7,850.00 $ 9,725.00 $ 9,725.00 $ 9,725.00 $ 9,725.00 $ 8,350.00 $ 9,725.00 $ 9,725.00 $ $ 8,350.00 $ 7,950.00 $106,550.00 8,879.17 25 Commission 8.5% $ 1,818.49 $ 2,036.26 $ 2, 115.91 $ 2,478.43 $ 2,564.88 $ 2,723.83 $ 2,966.93 $ 2,528.07 $ 2,652.43 $ 3,089.50 $ 2,894.76 $ 2,512.77 $ 30,382.23 2,531.85 26 27 TOTAL EXPENSE $28,923.49 $30,762.26 $31,429.91 $32,043.43 $32,580.88 $33,075.83 $35,048.93 $29,550.07 $34, 190.43 $34,821.50 $31,900.76 $28,675.77 $383,003.2328 29 Rent Monthly (%) 9.33% 8.78% 8.59% 8.43% 8.29% 8. 16% 7.70% 9.14% 7.90% 8.33% 9.09% 10.11% 30 Utilities Monthly (%) 4.80% 4.78% 5.03% 4.14% 4.29% 3.76% 3.39% 3.70% 4.53% 4.56% 4.38% 4.38% 31 Cost of Goods Monthly (%) 30.17% 30.15% 30.40% 27.88% 28.24% 29.15% 28.06% 28.40% 28.50% 28.78% 29.39% 27.74% 32 Parts Monthly (%) 22.28% 24.16% 24.27% 21.47% 21.46% 21.29% 24.63% 21.95% 22.87% 21.53% 21.89% 21.28% 33 Salaries Monthly (%) 27.14% 25.52% 24.98% 30.35% 29.85% 29.40% 27.75% 28.26% 28.44% 27.93% 26.17% 27.72% 34 Commission Monthly (%) 6.29% 6.62% 6.73% 7.73% 7.87% 8.24% 8.47% 8.56% 7.76% 8.87% 9.07% 8.76% 35 36 Monthly Expense Percentage: 7.55% 8.03% 8.21% 8.37% 8.51% 8.64% 9.15% 7.72% 8.93% 9.09% 8.33% 7.49% 37 38 NET PROFIT/LOSS $ 4,947.51 $ 8,367.74 $ 9,469.10 $11,632.57 $12,090.13 $14,498.18 $17,362.08 $16,806.93 $13,387.58 $16,961.51 $17,965.24 $14,872.23 $158,360.77 39E H J K L M N O A B C D F G Business Budget 2018 W N - APR MAY JUNE JULY AUG SEPT OCT NOV DEC TOTAL Income JAN FEB MAR 5 Sales 6 Service 7 Other 8 $ $ $ $ $ $ $ $ - $ - $ - $ - 9 TOTAL INCOME $ 10 11 Expenses 12 13 Rent 14 Utilities 15 Cost of Goods 16 Parts 17 Salaries $ - $ $ - - $ $ 18 Commission $ $ - 0.09 19 $ $ $ $ $ $ $ $ $ 20 TOTAL EXPENSE 21 22 NET PROFIT/LOSS $ $ $ $ $ $ $ $ $ $ $ 23

Step by Step Solution

There are 3 Steps involved in it

1 Expert Approved Answer
Step: 1 Unlock blur-text-image
Question Has Been Solved by an Expert!

Get step-by-step solutions from verified subject matter experts

Step: 2 Unlock
Step: 3 Unlock

Students Have Also Explored These Related Accounting Questions!