

Question: Determine whether the following graph can represent a variable with a normal '6 distribution. Explain your reasoning. If the graph appears to represent a normal

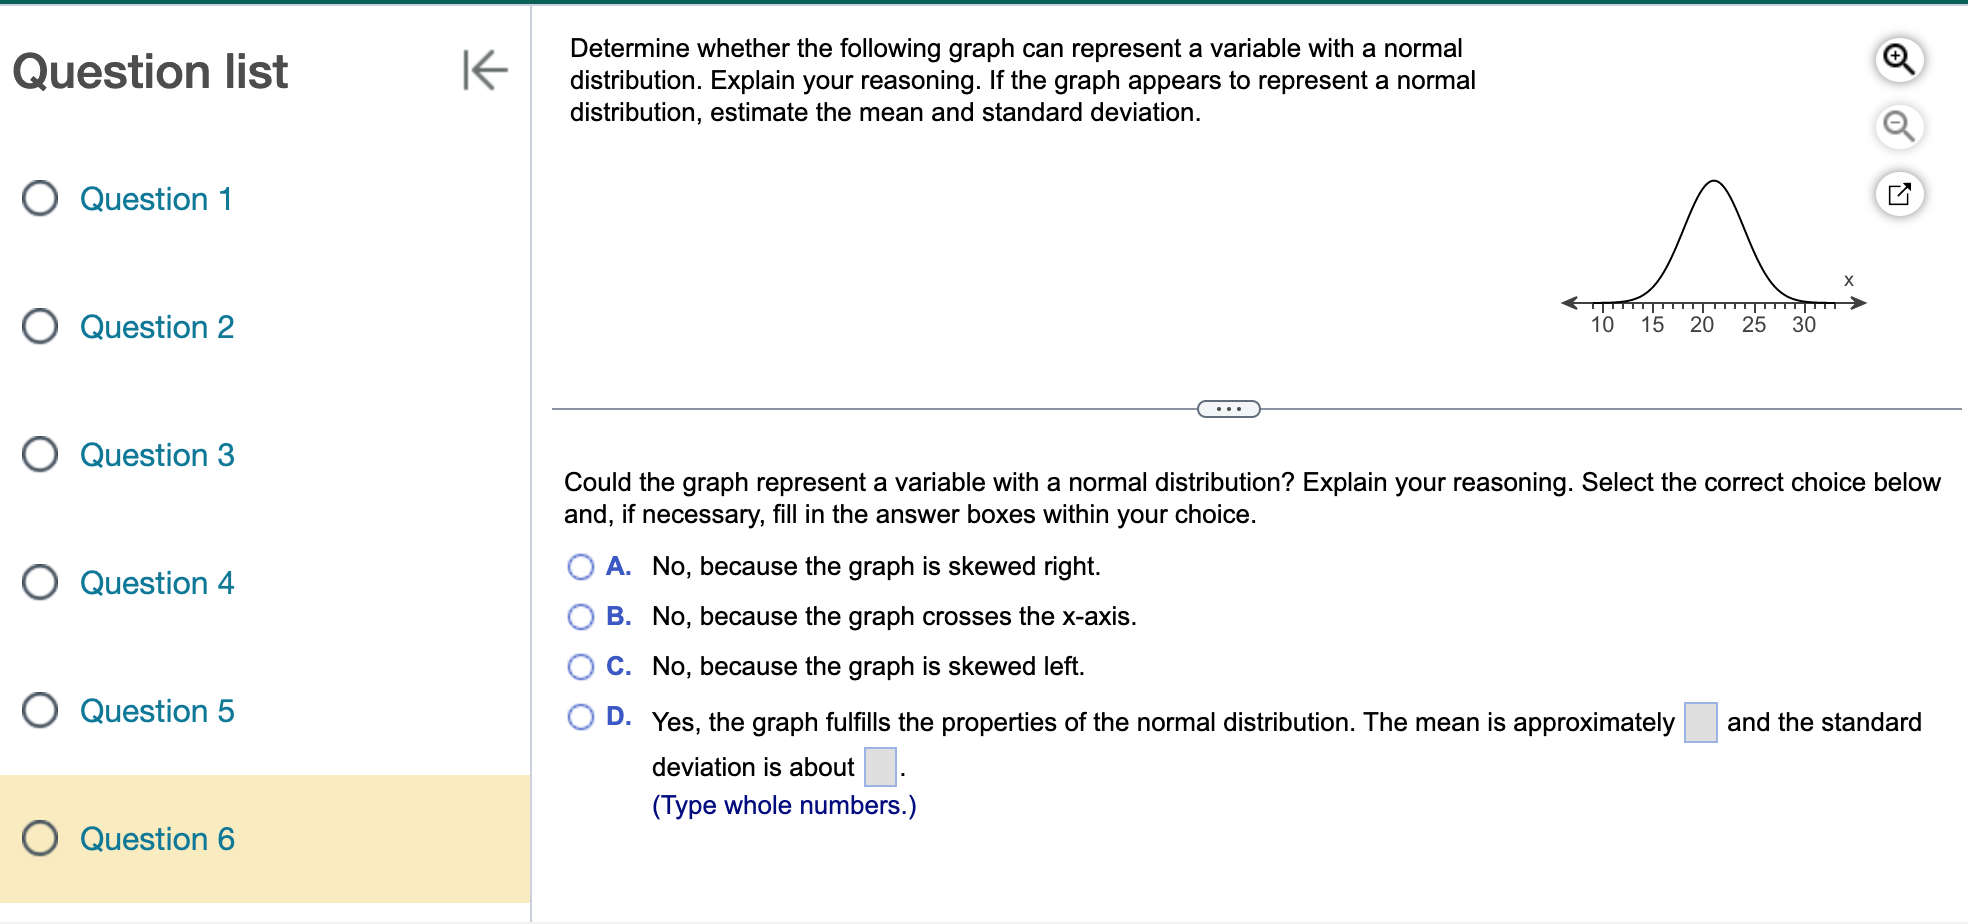
Determine whether the following graph can represent a variable with a normal '6 distribution. Explain your reasoning. If the graph appears to represent a normal distribution, estimate the mean and standard deviation. Question list Q,@ Q Question 1 D\" O Question2 1o 15 20 25 30 O Question 3 Could the graph represent a variable with a normal distribution? Explain your reasoning. Select the correct choice below and, if necessary, fill in the answer boxes within your choice. {:2- A. No, because the graph is skewed right. O Question 4 {:2 B. No, because the graph crosses the xaxis. (:3 C. No, because the graph is skewed left. O QueStion 5 '33:? D- Yes, the graph fullls the properties ofthe normal distribution. The mean is approximately and the standard deviation is about (Type whole numbers.) 0 Question 6
Step by Step Solution
There are 3 Steps involved in it

Get step-by-step solutions from verified subject matter experts