

Question: This question: 1 Submit quiz iana point(s) possible Edi ed Determine whether the following graph can represent a variable with a normal distribution. Explain your
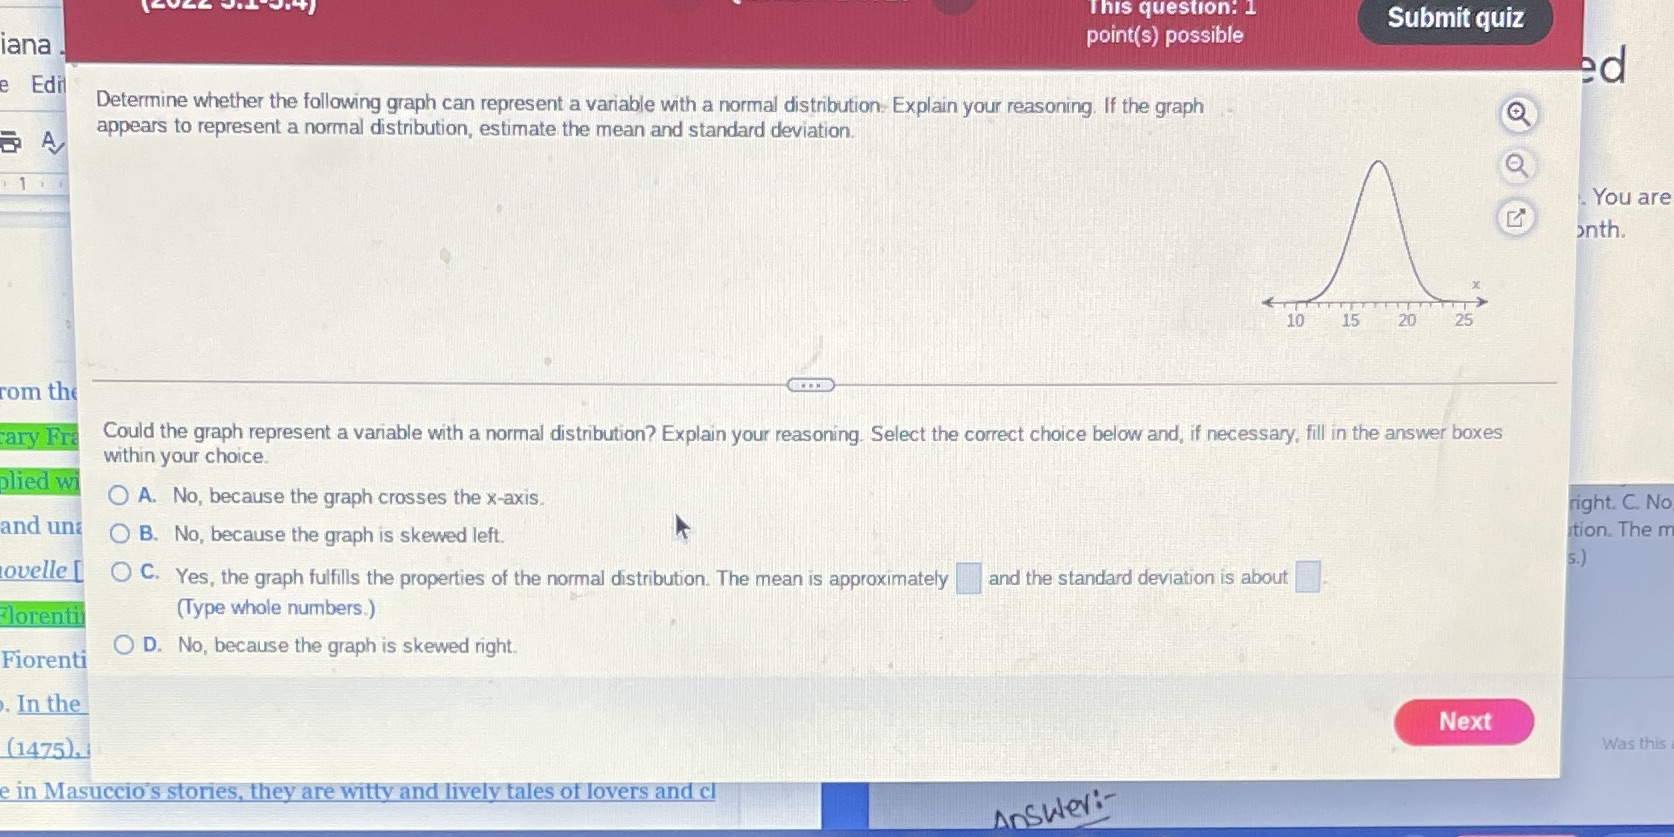
This question: 1 Submit quiz iana point(s) possible Edi ed Determine whether the following graph can represent a variable with a normal distribution. Explain your reasoning. If the graph appears to represent a normal distribution, estimate the mean and standard deviation. You are onth. x 10 15 20 25 rom the ary Fra Could the graph represent a variable with a normal distribution? Explain your reasoning. Select the correct choice below and, if necessary, fill in the answer boxes within your choice. plied wi O A. No, because the graph crosses the x-axis, right. C. No and un O B. No, because the graph is skewed left. tion. The m 5. ovelle [ O C. Yes, the graph fulfills the properties of the normal distribution. The mean is approximately and the standard deviation is about Florentin (Type whole numbers.) Fiorenti O D. No, because the graph is skewed right. In the Next (1475) Was this e in Masuccio's stories, they are witty and lively tales of lovers and cl
Step by Step Solution
There are 3 Steps involved in it

Get step-by-step solutions from verified subject matter experts