

Question: Determining Fixed vs . Variable Cost Components Using Excel ( Diagnostic Analytics ) Required Note: Round all answers to two decimals. analysis, along with the
Determining Fixed vs Variable Cost Components Using Excel Diagnostic Analytics
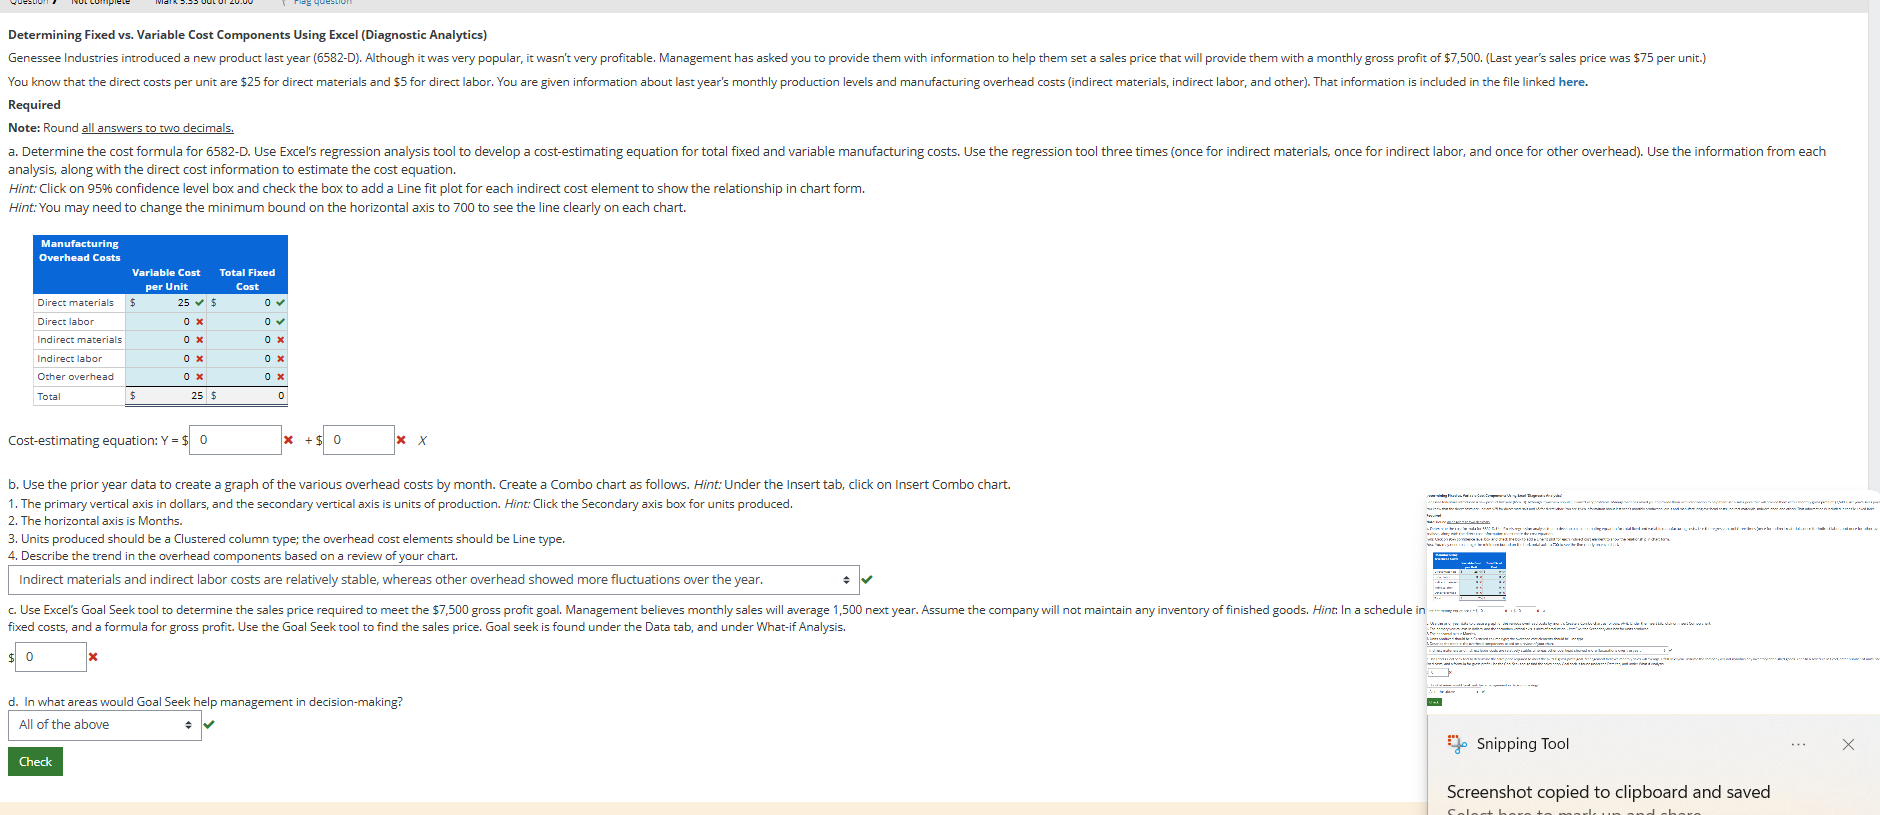
Required
Note: Round all answers to two decimals. analysis, along with the direct cost information to estimate the cost equation.
Hint: Click on confidence level box and check the box to add a Line fit plot for each indirect cost element to show the relationship in chart form.
Hint: You may need to change the minimum bound on the horizontal axis to to see the line clearly on each chart.
Costestimating equation: Y$
b Use the prior year data to create a graph of the various overhead costs by month. Create a Combo chart as follows. Hint: Under the Insert tab, click on Insert Combo chart.
The primary vertical axis in dollars, and the secondary vertical axis is units of production. Hint: Click the Secondary axis box for units produced.
The horizontal axis is Months.
Units produced should be a Clustered column type; the overhead cost elements should be Line type.
Describe the trend in the overhead components based on a review of your chart.
Indirect materials and indirect labor costs are relatively stable, whereas other overhead showed more fluctuations over the year. fixed costs, and a formula for gross profit. Use the Goal Seek tool to find the sales price. Goal seek is found under the Data tab, and under Whatif Analysis.
d In what areas would Goal Seek help management in decisionmaking?
Step by Step Solution
There are 3 Steps involved in it
1 Expert Approved Answer
Step: 1 Unlock

Question Has Been Solved by an Expert!
Get step-by-step solutions from verified subject matter experts
Step: 2 Unlock
Step: 3 Unlock