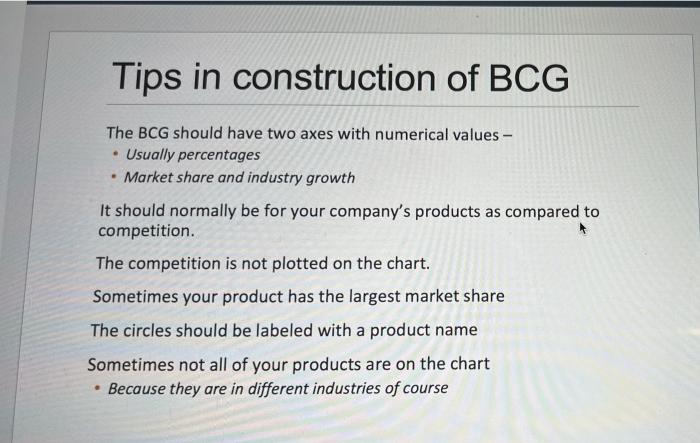
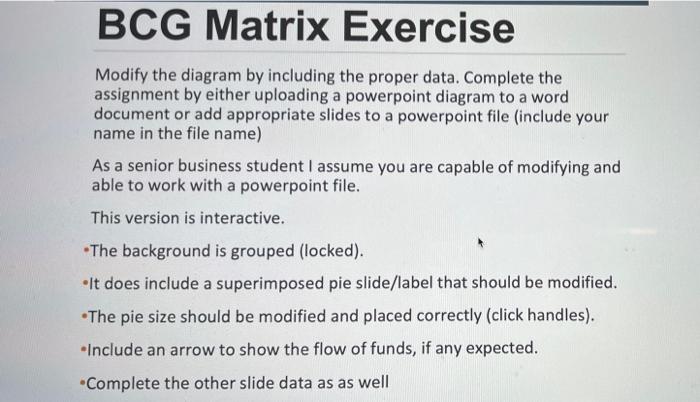
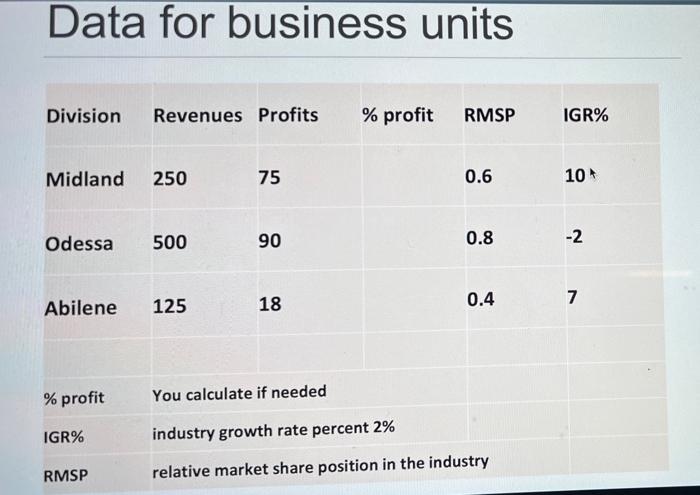
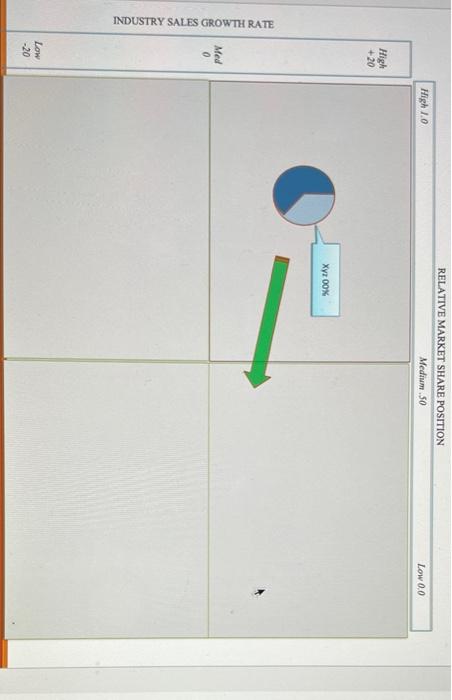
Question: Develop a BCG Matrix for the company (within the template below). Show the ideal flow of funds with arrows. Comment in a paragraph the findings

  1. Develop a BCG Matrix for the company (within the template below).
  2. Show the ideal flow of funds with arrows.
  3. Comment in a paragraph the findings and significance and suggested strategy.
Develop a BCG Matrix for the company (within the
Tips in construction of BCG The BCG should have two axes with numerical values - Usually percentages Market share and industry growth . It should normally be for your company's products as compared to competition The competition is not plotted on the chart. Sometimes your product has the largest market share The circles should be labeled with a product name Sometimes not all of your products are on the chart Because they are in different industries of course BCG Matrix Exercise Modify the diagram by including the proper data. Complete the assignment by either uploading a powerpoint diagram to a word document or add appropriate slides to a powerpoint file (include your name in the file name) As a senior business student I assume you are capable of modifying and able to work with a powerpoint file. This version is interactive. The background is grouped (locked). It does include a superimposed pie slide/label that should be modified. The pie size should be modified and placed correctly (click handles). Include an arrow to show the flow of funds, if any expected. Complete the other slide data as as well Data for business units Division Revenues Profits % profit RMSP IGR% Midland 250 75 0.6 10 Odessa 500 90 0.8 -2 0.4 18 7 Abilene 125 % profit You calculate if needed IGR% industry growth rate percent 2% RMSP relative market share position in the industry RELATIVE MARKET SHARE POSITION Medium 50 High 1.0 Low 0.0 High +20 Xyz00X Med 0 INDUSTRY SALES GROWTH RATE Low -20 Findings & Best Strategy Division Findings Strategy A A B Comment

Step by Step Solution

There are 3 Steps involved in it

1 Expert Approved Answer
Step: 1 Unlock blur-text-image
Question Has Been Solved by an Expert!

Get step-by-step solutions from verified subject matter experts

Step: 2 Unlock
Step: 3 Unlock

Students Have Also Explored These Related General Management Questions!