

Question: Develop a LINE chart using the data below. 3 Time Period Units Sold 33 B C D E F G H I J K L
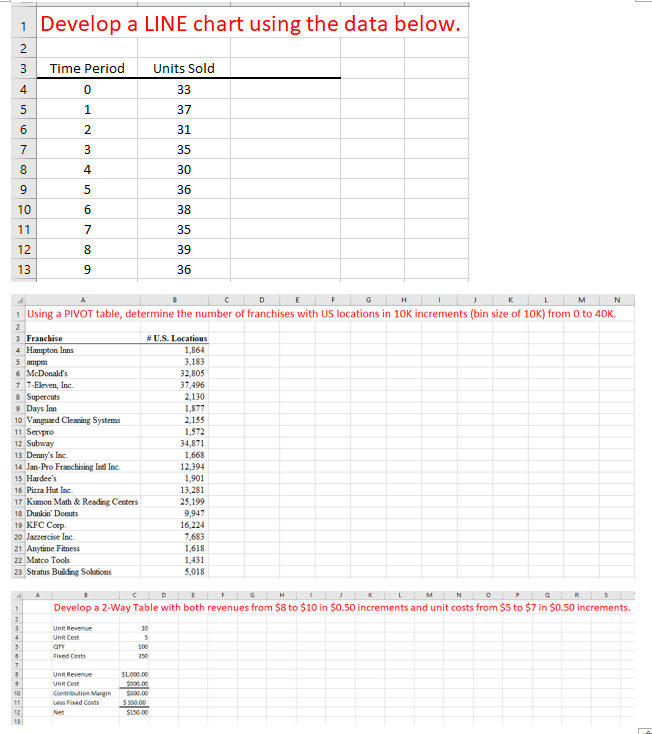
Develop a LINE chart using the data below. 3 Time Period Units Sold 33 B C D E F G H I J K L M N 1 Using a PIVOT table, determine the number of franchises with US locations in 10K increments (bin size of 10K) from 0 to 40K. 3 Franchise 4 Hampton Inns 5 ampe 6 McDonald's 7 7 Eleven, Inc. 8 Supercuts 9 Days Inn 10 Vanguard Cleaning Systems 11 Servpro 12 Subway 13 Denny's Inc 14 Jan-Pro Franchising Ind Ine. 15 Hardee's 16 Pizza Hut Inc 17 Kumon Math & Reading Centers 18 Dunkin' Donuts 19 KFC Corp 20 Jarrercise Ine. 21 Anytime Fitness 22 Matco Tools 23 Stratus Building Solutions # U.S. Locations 1.864 3.183 32 805 37 496 2.130 1,877 2.155 1,372 34 871 1.668 12.394 1.901 13.281 25.199 9947 16.224 7,683 1,618 1.431 3,018 C D E F G H I J K L M N O P Q R 5 Develop a 2-Way Table with both revenues from $8 to $10 in $0.50 increments and unit costs from $5 to $7 in $0.50 increments. Unit Revenue Unit Cost Fixed Costs SL000.00 Unit Revenue Unit Cott Contribution Margin Less Fixed Costs $500.00 S 350.00 $150,00
Step by Step Solution
There are 3 Steps involved in it

Get step-by-step solutions from verified subject matter experts