

Question: Develop a MATLAB code that is capable of the followings: a) Your code can interactively plot a Mohr's circle for a set of stresses (ox,
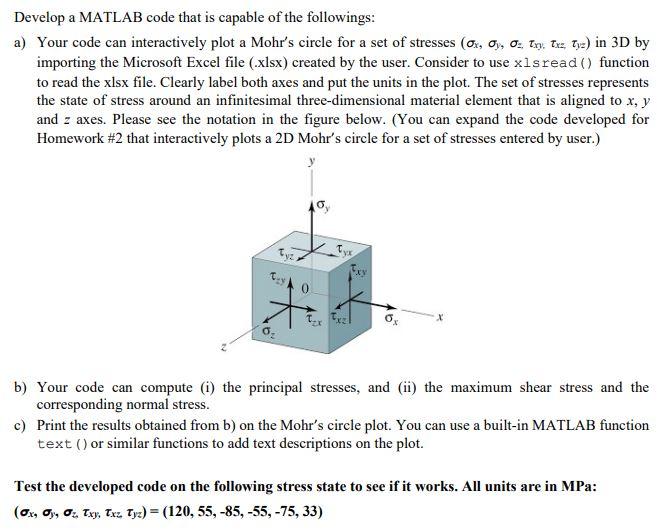
Develop a MATLAB code that is capable of the followings: a) Your code can interactively plot a Mohr's circle for a set of stresses (ox, oy, 0 Try. Txz. Tyz) in 3D by importing the Microsoft Excel file (.xlsx) created by the user. Consider to use xlsread() function to read the xlsx file. Clearly label both axes and put the units in the plot. The set of stresses represents the state of stress around an infinitesimal three-dimensional material element that is aligned to x, y and 2 axes. Please see the notation in the figure below. (You can expand the code developed for Homework #2 that interactively plots a 2D Mohr's circle for a set of stresses entered by user.) Tyz 0 x b) Your code can compute (i) the principal stresses, and (ii) the maximum shear stress and the corresponding normal stress. c) Print the results obtained from b) on the Mohr's circle plot. You can use a built-in MATLAB function text () or similar functions to add text descriptions on the plot. Test the developed code on the following stress state to see if it works. All units are in MPa: (ox, 0, 0, Txy, Txz Tyz) = (120, 55, -85, -55, -75, 33) Develop a MATLAB code that is capable of the followings: a) Your code can interactively plot a Mohr's circle for a set of stresses (ox, oy, 0 Try. Txz. Tyz) in 3D by importing the Microsoft Excel file (.xlsx) created by the user. Consider to use xlsread() function to read the xlsx file. Clearly label both axes and put the units in the plot. The set of stresses represents the state of stress around an infinitesimal three-dimensional material element that is aligned to x, y and 2 axes. Please see the notation in the figure below. (You can expand the code developed for Homework #2 that interactively plots a 2D Mohr's circle for a set of stresses entered by user.) Tyz 0 x b) Your code can compute (i) the principal stresses, and (ii) the maximum shear stress and the corresponding normal stress. c) Print the results obtained from b) on the Mohr's circle plot. You can use a built-in MATLAB function text () or similar functions to add text descriptions on the plot. Test the developed code on the following stress state to see if it works. All units are in MPa: (ox, 0, 0, Txy, Txz Tyz) = (120, 55, -85, -55, -75, 33)
Step by Step Solution
There are 3 Steps involved in it

Get step-by-step solutions from verified subject matter experts