

Question: Develop a Simulink computer program to simulate food routing through a reservoir described by equations ( 1 ) through ( 5 ) The storage capacity
Develop a Simulink computer program to simulate food routing through a reservoir described by equations through
The storage capacity of the reservoir above the spllway crest is shown in Figure The highest recorded hour
inflow hydrograph into the reservoir for a year recurrence interval is shown in Figure Assume that the spillway
structure has the articulated design with the following parameters
Orop box inlet has an foot effective edge
Box inlet has an unobstructed approach :
"The outlet pipe is a foot long. inch, circular, concrele pipe
The pipe has a square inlet and a fully exposed outlet foot below the spillway crest
Use your program to compute the discharge and the stage of the reservoir in response to the inflow hydrograph of
Figure assuming that the pond was just full when the water inflow started. Use your program to examine the following
variations in the design parameters assume that the original design will be maintained except for the variation:
A inch outlet pipe
A inch outlet pipe
Pipe outlet is foot below crest.
Pipe outlet is foot below crest
Discuss your program and your results.
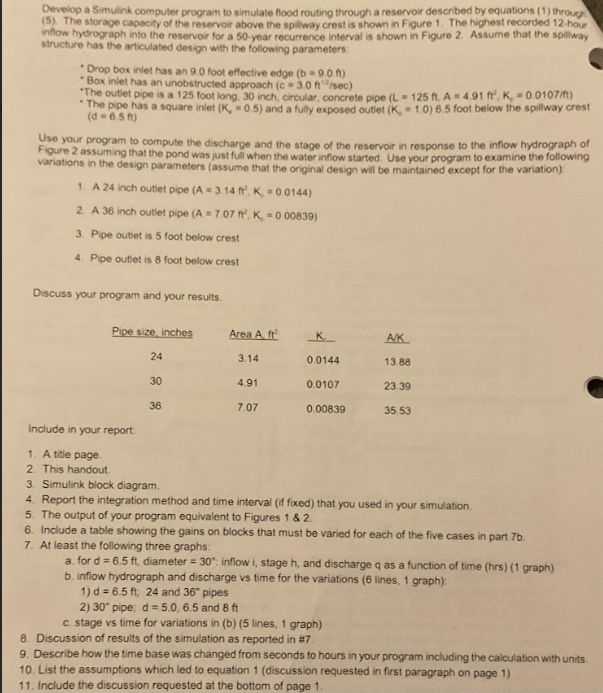
Pipe size, inches
Include in your report:
A title page.
This handout.
Simulink block diagram.
Report the integration method and time interval if fixed that you used in your simulation.
The output of your program equivalent to Figures &
Include a table showing the gains on blocks that must be varied for each of the five cases in part
At least the following three graphs:
a for diameter ; inflow stage and discharge as a function of time hrs graph
b inflow hydrograph and discharge vs time for the variations lines, graph:
; and pipes
pipe; and
c stage vs time for variations in b lines, graph
Discussion of results of the simulation as reported in #
Describe how the time base was changed from seconds to hours in your program including the calculation with units
List the assumptions which led to equation discussion requested in first paragraph on page
Include the discussion requested at the bottom of page
Step by Step Solution
There are 3 Steps involved in it
1 Expert Approved Answer
Step: 1 Unlock

Question Has Been Solved by an Expert!
Get step-by-step solutions from verified subject matter experts
Step: 2 Unlock
Step: 3 Unlock