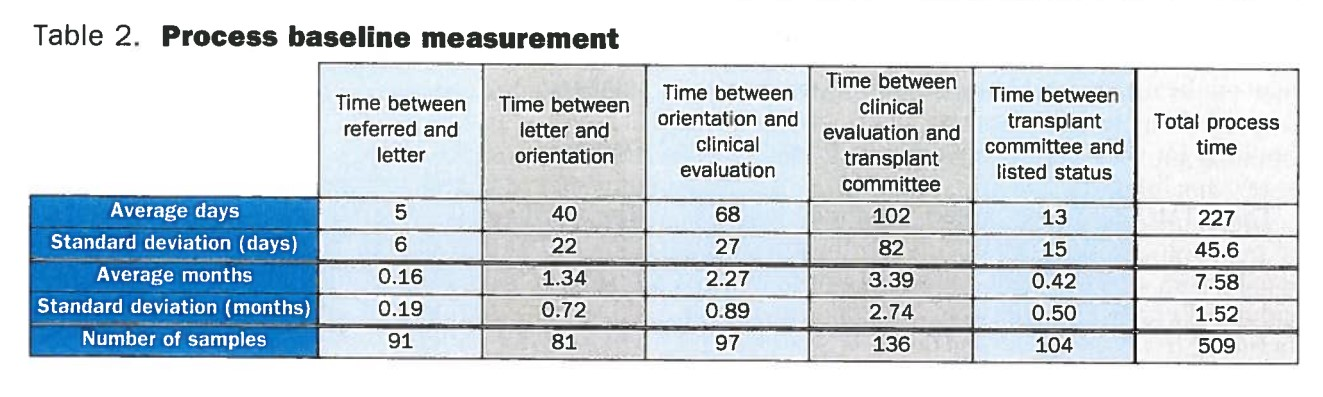
Question: Develop a Value Stream Map based on the process steps and average lead time in Table 2: Process Baseline Measurement within this case study Baseline

Develop a Value Stream Map based on the process steps and average lead time in Table 2: Process Baseline Measurement within this case study

Develop a Value Stream Map based on the process

Baseline Assumptions:

  • There is 100 referral records of inventory prior "Time Between referred and letter"
  • Document any assumptions
  • Determine the following KPIs:
    1. PLT
    2. PCE
    3. ALT
Table 2. Process baseline measurement Time between referred and letter Time between letter and orientation Time between orientation and clinical evaluation Time between transplant committee and listed status Total process time 5 40 68 Time between clinical evaluation and transplant committee 102 82 3.39 2.74 136 13 6 22 Average days Standard deviation (days) Average months Standard deviation (months) Number of samples 27 0.16 0.19 1.34 0.72 2.27 0.89 97 15 0.42 0.50 104 227 45.6 7.58 1.52 509 91 81 Table 2. Process baseline measurement Time between referred and letter Time between letter and orientation Time between orientation and clinical evaluation Time between transplant committee and listed status Total process time 5 40 68 Time between clinical evaluation and transplant committee 102 82 3.39 2.74 136 13 6 22 Average days Standard deviation (days) Average months Standard deviation (months) Number of samples 27 0.16 0.19 1.34 0.72 2.27 0.89 97 15 0.42 0.50 104 227 45.6 7.58 1.52 509 91 81

Step by Step Solution

There are 3 Steps involved in it

1 Expert Approved Answer
Step: 1 Unlock blur-text-image
Question Has Been Solved by an Expert!

Get step-by-step solutions from verified subject matter experts

Step: 2 Unlock
Step: 3 Unlock

Students Have Also Explored These Related General Management Questions!