Question: I promise i will give thumbs up. Make (Value Stream Map) please. Map the value stream. This principle involves recording and analyzing the flow of
I promise i will give thumbs up.
Make (Value Stream Map) please.
Map the value stream. This principle involves recording and analyzing the flow of information or materials required to produce a specific product or service with the intent of identifying waste and methods of improvement. Value stream mapping encompasses the product's entire lifecycle, from raw materials through to disposal.
Companies must examine each stage of the cycle for waste. Anything that does not add value must be eliminated. Lean thinking recommends supply chain alignment as part of this effort.
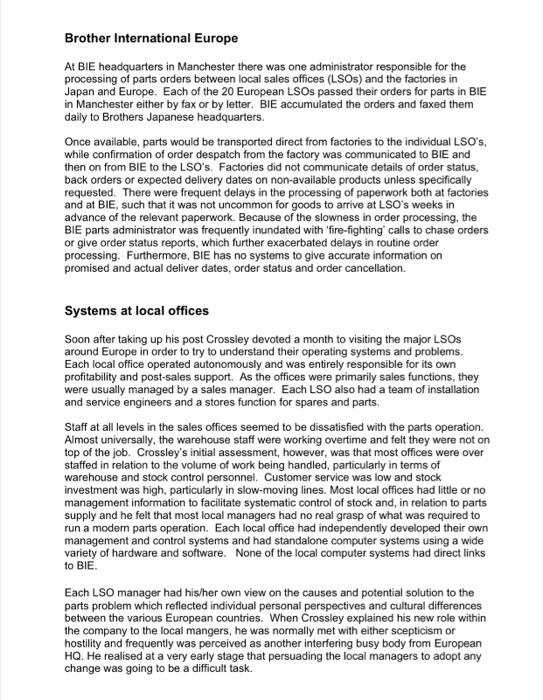
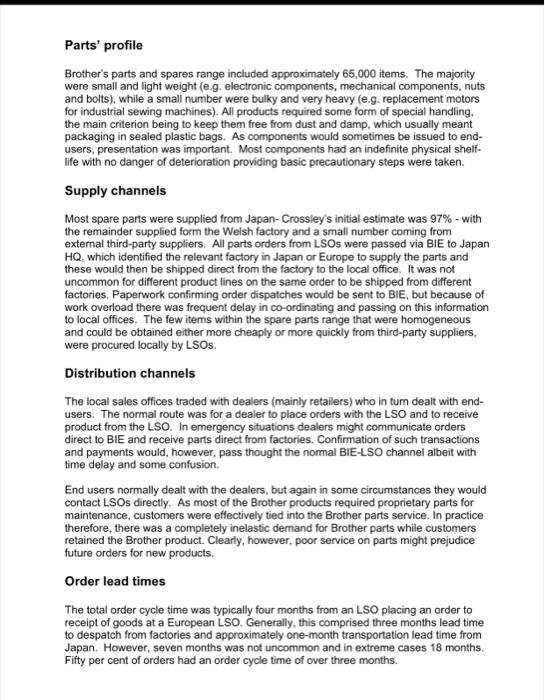
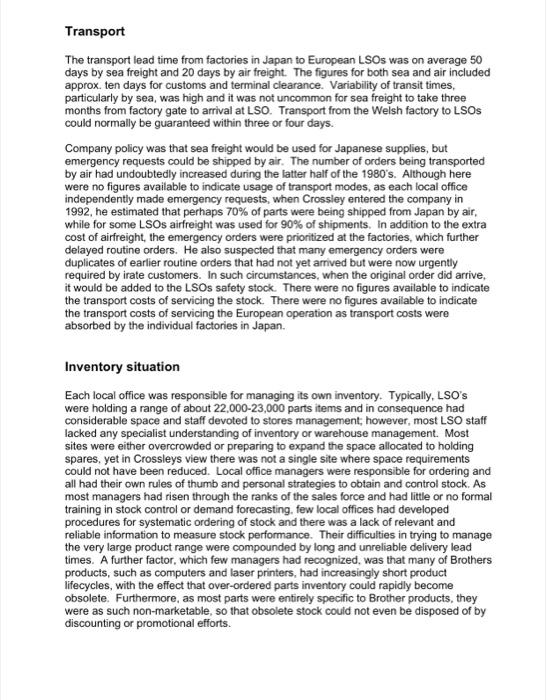
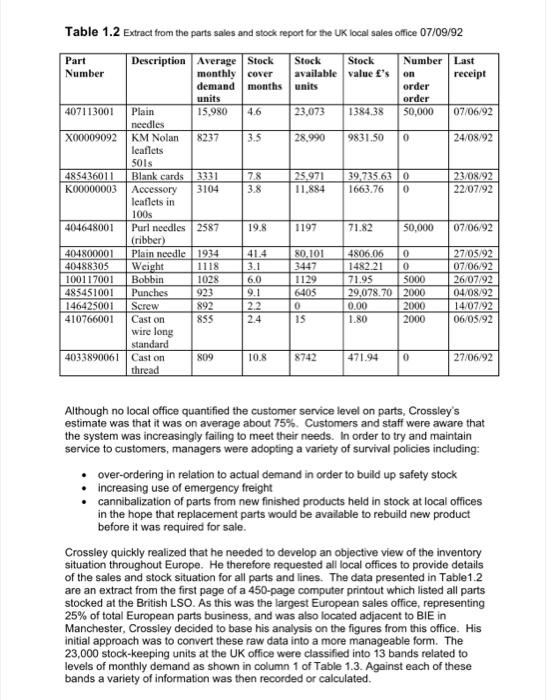
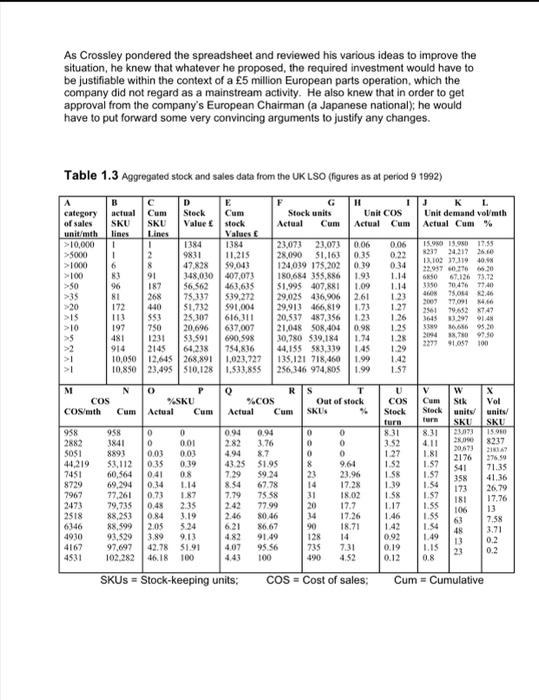
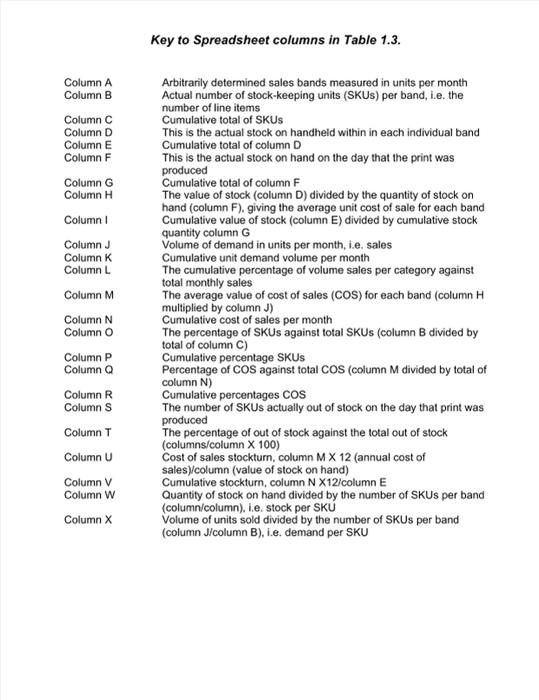
Major Text based case study Brother International European distribution strategy Introduction On 10 January 1993, Martin Crossley recently appointed European Parts Manager for Brother International, arrived at his office early, told his secretary that he did not want to receive any telephone calls or visitors that day, took of his jacket and settled down to work. On his desk were two documents, one a report summarizing his recently completed review of the company's European parts operation, and the other a spreadsheet he had completed the previous day showing an analysis of the parts inventory situation at the company's largest European sales office, which happened to be in Britain. In four weeks' time he had a meeting with the company's European Chairman to outline his preferred strategy to improve and develop the company's parts supply system, and although he did not know what proposals he was going to make, he did know that he had an awful lot of work to do. Company background Brother International is a major Japanese manufacturer supplying a wide range of electrical and electronic goods. It is a leading producer of word processors, laser printers, personal computers and colour copiers, which are supplied from factories in Japan. In Europe the company has one manufacturing plant located at Ruabon in Wales which produces typewriters and microwave ovens. The European market is served through 20 sales offices located in 13 European countries (Table 1.1). Brother International Europe (BIE) based in Manchester, UK carries out a co-ordinating role for the sales offices but has no direct line responsibility. The sales offices are each independent profit centres and report directly to headquarters in Japan. One area for which BIE does, however, have responsibility is the co-ordination of the procurement of spares and parts required by the European sales offices. Table 1.1 European countries in which Brother International has sales offices. United Kingdom Denmark Norway Sweden Finland The Netherlands Germany Austria Italy France Switzerland Belgium Ireland As with many electronics companies, the 1980's saw a period of very rapid growth and expansion for Brother. The company had aggressive marketing policies which targeted a doubling in sales volume every two years and by 1990 the company's total turnover in Europe reached 400 million. During this growth period relatively little management resource had been devoted to distribution issues, as the company was essentially sales led. As a result, the development of systems for distributing finished products and spares had tended to lag behind the growth in sales and there was increasing concern within the company about the level of after sales service being offered to customers. Virtually all of the company's product range required after sales service in terms of maintenance and repair and there was a continual demand for parts, the majority of which were supplied exclusively by Brother. The parts operation had grown in line with the growth in the business and by 1992 was supplying parts to the value of some 5 million at cost. Demand for parts lagged behind the sales of new products, with maximum demand occurring a few years after the initial product sale and then trailing off as products reached the end of their lifecycle. By the early 1990's there was a growing feeling of dissatisfaction in the company with the parts supply systems operation in Europe. There seemed to be an increasing number of complaints from customers and service engineers about waiting times for parts, Managers and staff in the European sales offices were unhappy about the availability of parts and stock and with the accuracy and speed with which parts orders were fulfilled. Meanwhile senior finance managers in BIE were expressing concerns that the level and cost of holding inventory in Europe was too high. However, no-one in the company had clearly identified the real nature or cause of the problem. In response to these growing concerns the company decided in 1992 to appoint a European Parts Operation Manager. The brief was to review the parts system and make the necessary alterations to achieve an acceptable parts management situation. The person selected was Martin Crossley, who had previously held positions as parts manager with other major companies and had recently completed a master's degree in Logistics Management Interestingly, Crossley was the first professional logistician to appointed anywhere within Brother's world-wide operation. On taking up his appointment Crossley's first task was to gain a clear picture of the current systems for parts supply within Brother's European markets. The following sections outline his findings. Brother International Europe At BIE headquarters in Manchester there was one administrator responsible for the processing of parts orders between local sales offices (LSOs) and the factories in Japan and Europe. Each of the 20 European LSOs passed their orders for parts in BIE in Manchester either by fax or by letter. BIE accumulated the orders and faxed them daily to Brothers Japanese headquarters. Once available, parts would be transported direct from factories to the individual LSO's, while confirmation of order despatch from the factory was communicated to BIE and then on from BIE to the LSO's. Factories did not communicate details of order status, back orders or expected delivery dates on non-available products unless specifically requested. There were frequent delays in the processing of paperwork both at factories and at BIE, such that it was not uncommon for goods to arrive at LSO's weeks in advance of the relevant paperwork. Because of the slowness in order processing, the BIE parts administrator was frequently inundated with fire-fighting' calls to chase orders or give order status reports, which further exacerbated delays in routine order processing. Furthermore, BIE has no systems to give accurate information on promised and actual deliver dates, order status and order cancellation. Systems at local offices Soon after taking up his post Crossley devoted a month to visiting the major LSOS around Europe in order to try to understand their operating systems and problems. Each local office operated autonomously and was entirely responsible for its own profitability and post-sales support. As the offices were primarily sales functions, they were usually managed by a sales manager. Each LSO also had a team of installation and service engineers and a stores function for spares and parts, Staff at all levels in the sales offices seemed to be dissatisfied with the parts operation. Almost universally, the warehouse staff were working overtime and felt they were not on top of the job. Crossley's initial assessment, however, was that most offices were over staffed in relation to the volume of work being handled, particularly in terms of warehouse and stock control personnel. Customer service was low and stock investment was high, particularly in slow-moving lines. Most local offices had little or no management information to facilitate systematic control of stock and, in relation to parts supply and he felt that most local managers had no real grasp of what was required to run a modern parts operation. Each local office had independently developed their own management and control systems and had standalone computer systems using a wide variety of hardware and software. None of the local computer systems had direct links to BIE Each LSO manager had his/her own view on the causes and potential solution to the parts problem which reflected individual personal perspectives and cultural differences between the various European countries. When Crossley explained his new role within the company to the local mangers, he was normally met with either scepticism or hostility and frequently was perceived as another interfering busy body from European HQ. He realised at a very early stage that persuading the local managers to adopt any change was going to be a difficult task. Parts' profile Brother's parts and spares range included approximately 65,000 items. The majority were small and light weight (eg. electronic components, mechanical components, nuts and bolts), while a small number were bulky and very heavy (e.g. replacement motors for industrial sewing machines). All products required some form of special handling, the main criterion being to keep them free from dust and damp, which usually meant packaging in sealed plastic bags. As components would sometimes be issued to end- users, presentation was important. Most components had an indefinite physical shelf- life with no danger of deterioration providing basic precautionary steps were taken. Supply channels Most spare parts were supplied from Japan-Crossley's initial estimate was 97% - with the remainder supplied form the Welsh factory and a small number coming from external third-party suppliers. All parts orders from LSOs were passed via BIE to Japan HQ, which identified the relevant factory in Japan or Europe to supply the parts and these would then be shipped direct from the factory to the local office. It was not uncommon for different product lines on the same order to be shipped from different factories. Paperwork confirming order dispatches would be sent to BIE, but because of work overload there was frequent delay in co-ordinating and passing on this information to local offices. The few items within the spare parts range that were homogeneous and could be obtained either more cheaply or more quickly from third-party suppliers, were procured locally by LSOs. Distribution channels The local sales offices traded with dealers (mainly retailers) who in turn dealt with end- users. The normal route was for a dealer to place orders with the LSO and to receive product from the LSO. In emergency situations dealers might communicate orders direct to BIE and receive parts direct from factories. Confirmation of such transactions and payments would, however, pass thought the normal BIE-LSO channel albeit with time delay and some confusion. End users normally dealt with the dealers, but again in some circumstances they would contact LSOs directly. As most of the Brother products required proprietary parts for maintenance, customers were effectively tied into the Brother parts service. In practice therefore, there was a completely inelastic demand for Brother parts while customers retained the Brother product. Clearly, however, poor service on parts might prejudice future orders for new products. Order lead times The total order cycle time was typically four months from an LSO placing an order to receipt of goods at a European LSO. Generally, this comprised three months lead time to despatch from factories and approximately one-month transportation lead time from Japan. However, seven months was not uncommon and in extreme cases 18 months. Fifty per cent of orders had an order cycle time of over three months. Transport The transport lead time from factories in Japan to European LSOs was on average 50 days by sea freight and 20 days by air freight. The figures for both sea and air included approx. ten days for customs and terminal clearance. Variability of transit times, particularly by sea, was high and it was not uncommon for sea freight to take three months from factory gate to arrival at LSO. Transport from the Welsh factory to LSOS could normally be guaranteed within three or four days. Company policy was that sea freight would be used for Japanese supplies, but emergency requests could be shipped by air. The number of orders being transported by air had undoubtedly increased during the latter half of the 1980's. Although here were no figures available to indicate usage of transport modes, as each local office independently made emergency requests, when Crossley entered the company in 1992, he estimated that perhaps 70% of parts were being shipped from Japan by air, while for some LSOs airfreight was used for 90% of shipments. In addition to the extra cost of airfreight, the emergency orders were prioritized at the factories, which further delayed routine orders. He also suspected that many emergency orders were duplicates of earlier routine orders that had not yet arrived but were now urgently required by irate customers. In such circumstances, when the original order did arrive. it would be added to the LSOs safety stock. There were no figures available to indicate the transport costs of servicing the stock. There were no figures available to indicate the transport costs of servicing the European operation as transport costs were absorbed by the individual factories in Japan. Inventory situation Each local office was responsible for managing its own inventory. Typically, LSO's were holding a range of about 22,000-23,000 parts items and in consequence had considerable space and staff devoted to stores management, however, most LSO staff lacked any specialist understanding of inventory or warehouse management. Most sites were either overcrowded or preparing to expand the space allocated to holding spares, yet in Crossleys view there was not a single site where space requirements could not have been reduced. Local office managers were responsible for ordering and all had their own rules of thumb and personal strategies to obtain and control stock. As most managers had risen through the ranks of the sales force and had little or no formal training in stock control or demand forecasting, few local offices had developed procedures for systematic ordering of stock and there was a lack of relevant and reliable information to measure stock performance. Their difficulties in trying to manage the very large product range were compounded by long and unreliable delivery lead times. A further factor, which few managers had recognized, was that many of Brothers products, such as computers and laser printers, had increasingly short product lifecycles, with the effect that over-ordered parts inventory could rapidly become obsolete. Furthermore, as most parts were entirely specific to Brother products, they were as such non-marketable, so that obsolete stock could not even be disposed of by discounting or promotional efforts. Table 1.2 Extract from the parts sales and stock report for the UK local sales office 07/09/92 Part Description Average Stock Stock Stock Number Last Number monthly cover available value f's on receipt demand months units order units order 407113001 Plain 15.980 23,073 1384,38 50,000 07/06/92 needles X00009092 KM Nolan 8237 3.5 28.990 9831.50 0 24/08/92 leaflets SOIS 485436011 Blank cards 3331 7.8 25.971 39.735.630 23/08/92 K00000003 Accessory 3104 3.8 11.884 1663.76 0 22/07/92 leaflets in 100s 404648001 Purl needles 2587 19.8 1197 71.82 50,000 07/06/92 (ribber) 404800001 Plain needle 1934 41.4 80.101 4806.06 0 27/05/92 40488305 Weight 1118 3.1 3447 1482.21 0 07/06/92 100117001 Bobbin 1028 6.0 1129 71.95 S000 26/07/92 485451001 Punches 923 9.1 6405 29,078.70 2000 04/08/92 146425001 Screw 892 2.2 0 0.00 2000 14/07/92 410766001 Cast on 855 2.4 15 1.80 2000 06/05/92 wire long standard 4033890061 Cast on 809 10.8 8742 471.94 0 27/06/92 thread Although no local office quantified the customer service level on parts, Crossley's estimate was that it was on average about 75% Customers and staff were aware that the system was increasingly failing to meet their needs. In order to try and maintain service to customers, managers were adopting a variety of survival policies including: over-ordering in relation to actual demand in order to build up safety stock increasing use of emergency freight cannibalization of parts from new finished products held in stock at local offices in the hope that replacement parts would be available to rebuild new product before it was required for sale. Crossley quickly realized that he needed to develop an objective view of the inventory situation throughout Europe. He therefore requested all local offices to provide details of the sales and stock situation for all parts and lines. The data presented in Table1.2 are an extract from the first page of a 450-page computer printout which listed all parts stocked at the British LSO. As this was the largest European sales office, representing 25% of total European parts business, and was also located adjacent to BIE in Manchester, Crossley decided to base his analysis on the figures from this office. His initial approach was to convert these raw data into a more manageable form. The 23,000 stock-keeping units at the UK office were classified into 13 bands related to levels of monthly demand as shown in column 1 of Table 1.3. Against each of these bands a variety of information was then recorded or calculated. As Crossley pondered the spreadsheet and reviewed his various ideas to improve the situation, he knew that whatever he proposed, the required investment would have to be justifiable within the context of a 5 million European parts operation, which the company did not regard as a mainstream activity. He also knew that in order to get approval from the company's European Chairman (a Japanese national): he would have to put forward some very convincing arguments to justify any changes. Table 1.3 Aggregated stock and sales data from the UK LSO (figures as at period 9 1992) Cum F Stock units Actual Cum H IJ K L Unit COS Unit demand voldmth Actual Cum Actual Cum % ines A category of sales unit/mth >10,000 >500 >1000 >100 >50 >35 >20 >15 >10 > 0.06 0.22 0.34 1.14 B D E actual Cum Stock SKU SKU Value stock lines Values 1 1 1384 1384 1 2 9831 11.215 6 8 47.828 59,013 83 91 3-48,000 407,073 96 187 56.562 463,635 81 268 75.337 539.272 172 440 $1.732 591,004 113 353 25307 616,311 197 750 20,696 637.007 481 1231 53.591 690,598 914 2145 64.238 754,836 10,050 12.645 268,891 1.023,727 10.850 23,495 510,128 1.533,855 1.14 23,073 23.073 28.090 $1,163 124039 175,202 180.684 385,886 51.995 407,881 29,025 436 906 29.913 466,819 20,537 487,356 21.048 508,400 30,780 539.184 44,135 583,339 135,121 718,460 256,346 974,805 0.06 0.35 039 1.93 1.09 2.61 1.73 1.23 0.98 1.74 1.45 1.99 1.99 1.23 1.27 1.26 1.25 1.28 1.29 15.90 15.90 17.55 8239 24,217 26.10 1X1023731940 22.937 0.276 5.20 60 67,126 73.12 3850 70.476 77,40 75.0543.46 2009 770916 2561 79,652 742 3645.299 14 38001695,20 20948,799.50 227791057100 > 1.57 N V M COS COSmth 0 P %SKU Actual Cum 0 R %COS Actual Cum S T Out of stock SKUS % U COS Stock Cum Stock tur 8.31 958 2882 SOS 44,219 7451 8729 7967 2473 0.94 2.82 4.94 43.25 7.29 0 0 0 8 23 0.39 1.81 1.57 1.57 958 3841 8893 53.112 60,564 69,294 77,261 79,735 88.253 88,599 93,529 97.697 102.282 0 0 0 0.01 0.03 001 0.35 041 0.8 0.34 1.14 0.73 1.87 0.48 235 0.84 3.19 205 5.24 3.89 9.13 42.78 51 91 46.18 100 854 831 3.52 1.27 1.52 1.58 1.39 1.58 1.17 0.94 3.76 8.7 $1.95 59.24 67.78 7558 77.99 8046 86.67 91.49 95.56 100 w Sik Vol units/ units/ SKU SKU 2173 1500 28.00 8217 303673 2A 2176 376 59 S41 71.35 358 41.36 173 26.79 181 17.76 106 13 63 7.58 48 13 0.2 23 0.2 0 0 0 964 23.96 17.28 18.02 17.7 19.26 18.71 14 731 4.52 2518 7.79 2.42 2.46 6.21 4.82 407 443 1.46 6346 4930 4167 4531 31 20 14 90 128 735 490 1.42 0.92 0.19 0.12 1.57 1.55 1.35 1.54 1.49 L.IS 0.8 SKUS = Stock-keeping units; COS - Cost of sales: Cum = Cumulative Key to Spreadsheet columns in Table 1.3. Column A Column B Column C Column D Column E Column F Column G Column H Column Column J Column K Column L Column M Column N Column Arbitrarily determined sales bands measured in units per month Actual number of stock-keeping units (SKUS) per band, i.e. the number of line items Cumulative total of SKUS This is the actual stock on handheld within in each individual band Cumulative total of column D This is the actual stock on hand on the day that the print was produced Cumulative total of column F The value of stock (column D) divided by the quantity of stock on hand (column F), giving the average unit cost of sale for each band Cumulative value of stock (column E) divided by cumulative stock quantity column G Volume of demand in units per month, i.e. sales Cumulative unit demand volume per month The cumulative percentage of volume sales per category against total monthly sales The average value of cost of sales (COS) for each band (column H multiplied by column J) Cumulative cost of sales per month The percentage of SKUs against total SKUs (column B divided by total of column C) Cumulative percentage SKUs Percentage of cos against total cos (column M divided by total of column N) Cumulative percentages cos The number of SKUs actually out of stock on the day that print was produced The percentage of out of stock against the total out of stock (columns/column X 100) Cost of sales stockturn, column MX 12 (annual cost of sales) column (value of stock on hand) Cumulative stockturn, column NX12/column E Quantity of stock on hand divided by the number of SKUs per band (column/column), i.e. stock per SKU Volume of units sold divided by the number of SKUs per band (column J/column B), i.e. demand per SKU Column P Column Q Column R Columns Column T Column U Column V Column W Column Major Text based case study Brother International European distribution strategy Introduction On 10 January 1993, Martin Crossley recently appointed European Parts Manager for Brother International, arrived at his office early, told his secretary that he did not want to receive any telephone calls or visitors that day, took of his jacket and settled down to work. On his desk were two documents, one a report summarizing his recently completed review of the company's European parts operation, and the other a spreadsheet he had completed the previous day showing an analysis of the parts inventory situation at the company's largest European sales office, which happened to be in Britain. In four weeks' time he had a meeting with the company's European Chairman to outline his preferred strategy to improve and develop the company's parts supply system, and although he did not know what proposals he was going to make, he did know that he had an awful lot of work to do. Company background Brother International is a major Japanese manufacturer supplying a wide range of electrical and electronic goods. It is a leading producer of word processors, laser printers, personal computers and colour copiers, which are supplied from factories in Japan. In Europe the company has one manufacturing plant located at Ruabon in Wales which produces typewriters and microwave ovens. The European market is served through 20 sales offices located in 13 European countries (Table 1.1). Brother International Europe (BIE) based in Manchester, UK carries out a co-ordinating role for the sales offices but has no direct line responsibility. The sales offices are each independent profit centres and report directly to headquarters in Japan. One area for which BIE does, however, have responsibility is the co-ordination of the procurement of spares and parts required by the European sales offices. Table 1.1 European countries in which Brother International has sales offices. United Kingdom Denmark Norway Sweden Finland The Netherlands Germany Austria Italy France Switzerland Belgium Ireland As with many electronics companies, the 1980's saw a period of very rapid growth and expansion for Brother. The company had aggressive marketing policies which targeted a doubling in sales volume every two years and by 1990 the company's total turnover in Europe reached 400 million. During this growth period relatively little management resource had been devoted to distribution issues, as the company was essentially sales led. As a result, the development of systems for distributing finished products and spares had tended to lag behind the growth in sales and there was increasing concern within the company about the level of after sales service being offered to customers. Virtually all of the company's product range required after sales service in terms of maintenance and repair and there was a continual demand for parts, the majority of which were supplied exclusively by Brother. The parts operation had grown in line with the growth in the business and by 1992 was supplying parts to the value of some 5 million at cost. Demand for parts lagged behind the sales of new products, with maximum demand occurring a few years after the initial product sale and then trailing off as products reached the end of their lifecycle. By the early 1990's there was a growing feeling of dissatisfaction in the company with the parts supply systems operation in Europe. There seemed to be an increasing number of complaints from customers and service engineers about waiting times for parts, Managers and staff in the European sales offices were unhappy about the availability of parts and stock and with the accuracy and speed with which parts orders were fulfilled. Meanwhile senior finance managers in BIE were expressing concerns that the level and cost of holding inventory in Europe was too high. However, no-one in the company had clearly identified the real nature or cause of the problem. In response to these growing concerns the company decided in 1992 to appoint a European Parts Operation Manager. The brief was to review the parts system and make the necessary alterations to achieve an acceptable parts management situation. The person selected was Martin Crossley, who had previously held positions as parts manager with other major companies and had recently completed a master's degree in Logistics Management Interestingly, Crossley was the first professional logistician to appointed anywhere within Brother's world-wide operation. On taking up his appointment Crossley's first task was to gain a clear picture of the current systems for parts supply within Brother's European markets. The following sections outline his findings. Brother International Europe At BIE headquarters in Manchester there was one administrator responsible for the processing of parts orders between local sales offices (LSOs) and the factories in Japan and Europe. Each of the 20 European LSOs passed their orders for parts in BIE in Manchester either by fax or by letter. BIE accumulated the orders and faxed them daily to Brothers Japanese headquarters. Once available, parts would be transported direct from factories to the individual LSO's, while confirmation of order despatch from the factory was communicated to BIE and then on from BIE to the LSO's. Factories did not communicate details of order status, back orders or expected delivery dates on non-available products unless specifically requested. There were frequent delays in the processing of paperwork both at factories and at BIE, such that it was not uncommon for goods to arrive at LSO's weeks in advance of the relevant paperwork. Because of the slowness in order processing, the BIE parts administrator was frequently inundated with fire-fighting' calls to chase orders or give order status reports, which further exacerbated delays in routine order processing. Furthermore, BIE has no systems to give accurate information on promised and actual deliver dates, order status and order cancellation. Systems at local offices Soon after taking up his post Crossley devoted a month to visiting the major LSOS around Europe in order to try to understand their operating systems and problems. Each local office operated autonomously and was entirely responsible for its own profitability and post-sales support. As the offices were primarily sales functions, they were usually managed by a sales manager. Each LSO also had a team of installation and service engineers and a stores function for spares and parts, Staff at all levels in the sales offices seemed to be dissatisfied with the parts operation. Almost universally, the warehouse staff were working overtime and felt they were not on top of the job. Crossley's initial assessment, however, was that most offices were over staffed in relation to the volume of work being handled, particularly in terms of warehouse and stock control personnel. Customer service was low and stock investment was high, particularly in slow-moving lines. Most local offices had little or no management information to facilitate systematic control of stock and, in relation to parts supply and he felt that most local managers had no real grasp of what was required to run a modern parts operation. Each local office had independently developed their own management and control systems and had standalone computer systems using a wide variety of hardware and software. None of the local computer systems had direct links to BIE Each LSO manager had his/her own view on the causes and potential solution to the parts problem which reflected individual personal perspectives and cultural differences between the various European countries. When Crossley explained his new role within the company to the local mangers, he was normally met with either scepticism or hostility and frequently was perceived as another interfering busy body from European HQ. He realised at a very early stage that persuading the local managers to adopt any change was going to be a difficult task. Parts' profile Brother's parts and spares range included approximately 65,000 items. The majority were small and light weight (eg. electronic components, mechanical components, nuts and bolts), while a small number were bulky and very heavy (e.g. replacement motors for industrial sewing machines). All products required some form of special handling, the main criterion being to keep them free from dust and damp, which usually meant packaging in sealed plastic bags. As components would sometimes be issued to end- users, presentation was important. Most components had an indefinite physical shelf- life with no danger of deterioration providing basic precautionary steps were taken. Supply channels Most spare parts were supplied from Japan-Crossley's initial estimate was 97% - with the remainder supplied form the Welsh factory and a small number coming from external third-party suppliers. All parts orders from LSOs were passed via BIE to Japan HQ, which identified the relevant factory in Japan or Europe to supply the parts and these would then be shipped direct from the factory to the local office. It was not uncommon for different product lines on the same order to be shipped from different factories. Paperwork confirming order dispatches would be sent to BIE, but because of work overload there was frequent delay in co-ordinating and passing on this information to local offices. The few items within the spare parts range that were homogeneous and could be obtained either more cheaply or more quickly from third-party suppliers, were procured locally by LSOs. Distribution channels The local sales offices traded with dealers (mainly retailers) who in turn dealt with end- users. The normal route was for a dealer to place orders with the LSO and to receive product from the LSO. In emergency situations dealers might communicate orders direct to BIE and receive parts direct from factories. Confirmation of such transactions and payments would, however, pass thought the normal BIE-LSO channel albeit with time delay and some confusion. End users normally dealt with the dealers, but again in some circumstances they would contact LSOs directly. As most of the Brother products required proprietary parts for maintenance, customers were effectively tied into the Brother parts service. In practice therefore, there was a completely inelastic demand for Brother parts while customers retained the Brother product. Clearly, however, poor service on parts might prejudice future orders for new products. Order lead times The total order cycle time was typically four months from an LSO placing an order to receipt of goods at a European LSO. Generally, this comprised three months lead time to despatch from factories and approximately one-month transportation lead time from Japan. However, seven months was not uncommon and in extreme cases 18 months. Fifty per cent of orders had an order cycle time of over three months. Transport The transport lead time from factories in Japan to European LSOs was on average 50 days by sea freight and 20 days by air freight. The figures for both sea and air included approx. ten days for customs and terminal clearance. Variability of transit times, particularly by sea, was high and it was not uncommon for sea freight to take three months from factory gate to arrival at LSO. Transport from the Welsh factory to LSOS could normally be guaranteed within three or four days. Company policy was that sea freight would be used for Japanese supplies, but emergency requests could be shipped by air. The number of orders being transported by air had undoubtedly increased during the latter half of the 1980's. Although here were no figures available to indicate usage of transport modes, as each local office independently made emergency requests, when Crossley entered the company in 1992, he estimated that perhaps 70% of parts were being shipped from Japan by air, while for some LSOs airfreight was used for 90% of shipments. In addition to the extra cost of airfreight, the emergency orders were prioritized at the factories, which further delayed routine orders. He also suspected that many emergency orders were duplicates of earlier routine orders that had not yet arrived but were now urgently required by irate customers. In such circumstances, when the original order did arrive. it would be added to the LSOs safety stock. There were no figures available to indicate the transport costs of servicing the stock. There were no figures available to indicate the transport costs of servicing the European operation as transport costs were absorbed by the individual factories in Japan. Inventory situation Each local office was responsible for managing its own inventory. Typically, LSO's were holding a range of about 22,000-23,000 parts items and in consequence had considerable space and staff devoted to stores management, however, most LSO staff lacked any specialist understanding of inventory or warehouse management. Most sites were either overcrowded or preparing to expand the space allocated to holding spares, yet in Crossleys view there was not a single site where space requirements could not have been reduced. Local office managers were responsible for ordering and all had their own rules of thumb and personal strategies to obtain and control stock. As most managers had risen through the ranks of the sales force and had little or no formal training in stock control or demand forecasting, few local offices had developed procedures for systematic ordering of stock and there was a lack of relevant and reliable information to measure stock performance. Their difficulties in trying to manage the very large product range were compounded by long and unreliable delivery lead times. A further factor, which few managers had recognized, was that many of Brothers products, such as computers and laser printers, had increasingly short product lifecycles, with the effect that over-ordered parts inventory could rapidly become obsolete. Furthermore, as most parts were entirely specific to Brother products, they were as such non-marketable, so that obsolete stock could not even be disposed of by discounting or promotional efforts. Table 1.2 Extract from the parts sales and stock report for the UK local sales office 07/09/92 Part Description Average Stock Stock Stock Number Last Number monthly cover available value f's on receipt demand months units order units order 407113001 Plain 15.980 23,073 1384,38 50,000 07/06/92 needles X00009092 KM Nolan 8237 3.5 28.990 9831.50 0 24/08/92 leaflets SOIS 485436011 Blank cards 3331 7.8 25.971 39.735.630 23/08/92 K00000003 Accessory 3104 3.8 11.884 1663.76 0 22/07/92 leaflets in 100s 404648001 Purl needles 2587 19.8 1197 71.82 50,000 07/06/92 (ribber) 404800001 Plain needle 1934 41.4 80.101 4806.06 0 27/05/92 40488305 Weight 1118 3.1 3447 1482.21 0 07/06/92 100117001 Bobbin 1028 6.0 1129 71.95 S000 26/07/92 485451001 Punches 923 9.1 6405 29,078.70 2000 04/08/92 146425001 Screw 892 2.2 0 0.00 2000 14/07/92 410766001 Cast on 855 2.4 15 1.80 2000 06/05/92 wire long standard 4033890061 Cast on 809 10.8 8742 471.94 0 27/06/92 thread Although no local office quantified the customer service level on parts, Crossley's estimate was that it was on average about 75% Customers and staff were aware that the system was increasingly failing to meet their needs. In order to try and maintain service to customers, managers were adopting a variety of survival policies including: over-ordering in relation to actual demand in order to build up safety stock increasing use of emergency freight cannibalization of parts from new finished products held in stock at local offices in the hope that replacement parts would be available to rebuild new product before it was required for sale. Crossley quickly realized that he needed to develop an objective view of the inventory situation throughout Europe. He therefore requested all local offices to provide details of the sales and stock situation for all parts and lines. The data presented in Table1.2 are an extract from the first page of a 450-page computer printout which listed all parts stocked at the British LSO. As this was the largest European sales office, representing 25% of total European parts business, and was also located adjacent to BIE in Manchester, Crossley decided to base his analysis on the figures from this office. His initial approach was to convert these raw data into a more manageable form. The 23,000 stock-keeping units at the UK office were classified into 13 bands related to levels of monthly demand as shown in column 1 of Table 1.3. Against each of these bands a variety of information was then recorded or calculated. As Crossley pondered the spreadsheet and reviewed his various ideas to improve the situation, he knew that whatever he proposed, the required investment would have to be justifiable within the context of a 5 million European parts operation, which the company did not regard as a mainstream activity. He also knew that in order to get approval from the company's European Chairman (a Japanese national): he would have to put forward some very convincing arguments to justify any changes. Table 1.3 Aggregated stock and sales data from the UK LSO (figures as at period 9 1992) Cum F Stock units Actual Cum H IJ K L Unit COS Unit demand voldmth Actual Cum Actual Cum % ines A category of sales unit/mth >10,000 >500 >1000 >100 >50 >35 >20 >15 >10 > 0.06 0.22 0.34 1.14 B D E actual Cum Stock SKU SKU Value stock lines Values 1 1 1384 1384 1 2 9831 11.215 6 8 47.828 59,013 83 91 3-48,000 407,073 96 187 56.562 463,635 81 268 75.337 539.272 172 440 $1.732 591,004 113 353 25307 616,311 197 750 20,696 637.007 481 1231 53.591 690,598 914 2145 64.238 754,836 10,050 12.645 268,891 1.023,727 10.850 23,495 510,128 1.533,855 1.14 23,073 23.073 28.090 $1,163 124039 175,202 180.684 385,886 51.995 407,881 29,025 436 906 29.913 466,819 20,537 487,356 21.048 508,400 30,780 539.184 44,135 583,339 135,121 718,460 256,346 974,805 0.06 0.35 039 1.93 1.09 2.61 1.73 1.23 0.98 1.74 1.45 1.99 1.99 1.23 1.27 1.26 1.25 1.28 1.29 15.90 15.90 17.55 8239 24,217 26.10 1X1023731940 22.937 0.276 5.20 60 67,126 73.12 3850 70.476 77,40 75.0543.46 2009 770916 2561 79,652 742 3645.299 14 38001695,20 20948,799.50 227791057100 > 1.57 N V M COS COSmth 0 P %SKU Actual Cum 0 R %COS Actual Cum S T Out of stock SKUS % U COS Stock Cum Stock tur 8.31 958 2882 SOS 44,219 7451 8729 7967 2473 0.94 2.82 4.94 43.25 7.29 0 0 0 8 23 0.39 1.81 1.57 1.57 958 3841 8893 53.112 60,564 69,294 77,261 79,735 88.253 88,599 93,529 97.697 102.282 0 0 0 0.01 0.03 001 0.35 041 0.8 0.34 1.14 0.73 1.87 0.48 235 0.84 3.19 205 5.24 3.89 9.13 42.78 51 91 46.18 100 854 831 3.52 1.27 1.52 1.58 1.39 1.58 1.17 0.94 3.76 8.7 $1.95 59.24 67.78 7558 77.99 8046 86.67 91.49 95.56 100 w Sik Vol units/ units/ SKU SKU 2173 1500 28.00 8217 303673 2A 2176 376 59 S41 71.35 358 41.36 173 26.79 181 17.76 106 13 63 7.58 48 13 0.2 23 0.2 0 0 0 964 23.96 17.28 18.02 17.7 19.26 18.71 14 731 4.52 2518 7.79 2.42 2.46 6.21 4.82 407 443 1.46 6346 4930 4167 4531 31 20 14 90 128 735 490 1.42 0.92 0.19 0.12 1.57 1.55 1.35 1.54 1.49 L.IS 0.8 SKUS = Stock-keeping units; COS - Cost of sales: Cum = Cumulative Key to Spreadsheet columns in Table 1.3. Column A Column B Column C Column D Column E Column F Column G Column H Column Column J Column K Column L Column M Column N Column Arbitrarily determined sales bands measured in units per month Actual number of stock-keeping units (SKUS) per band, i.e. the number of line items Cumulative total of SKUS This is the actual stock on handheld within in each individual band Cumulative total of column D This is the actual stock on hand on the day that the print was produced Cumulative total of column F The value of stock (column D) divided by the quantity of stock on hand (column F), giving the average unit cost of sale for each band Cumulative value of stock (column E) divided by cumulative stock quantity column G Volume of demand in units per month, i.e. sales Cumulative unit demand volume per month The cumulative percentage of volume sales per category against total monthly sales The average value of cost of sales (COS) for each band (column H multiplied by column J) Cumulative cost of sales per month The percentage of SKUs against total SKUs (column B divided by total of column C) Cumulative percentage SKUs Percentage of cos against total cos (column M divided by total of column N) Cumulative percentages cos The number of SKUs actually out of stock on the day that print was produced The percentage of out of stock against the total out of stock (columns/column X 100) Cost of sales stockturn, column MX 12 (annual cost of sales) column (value of stock on hand) Cumulative stockturn, column NX12/column E Quantity of stock on hand divided by the number of SKUs per band (column/column), i.e. stock per SKU Volume of units sold divided by the number of SKUs per band (column J/column B), i.e. demand per SKU Column P Column Q Column R Columns Column T Column U Column V Column W Column