

Question: Develop the forecast using the demand data in the first column on the left; apply that forecast to determine error, etc., to the demand data
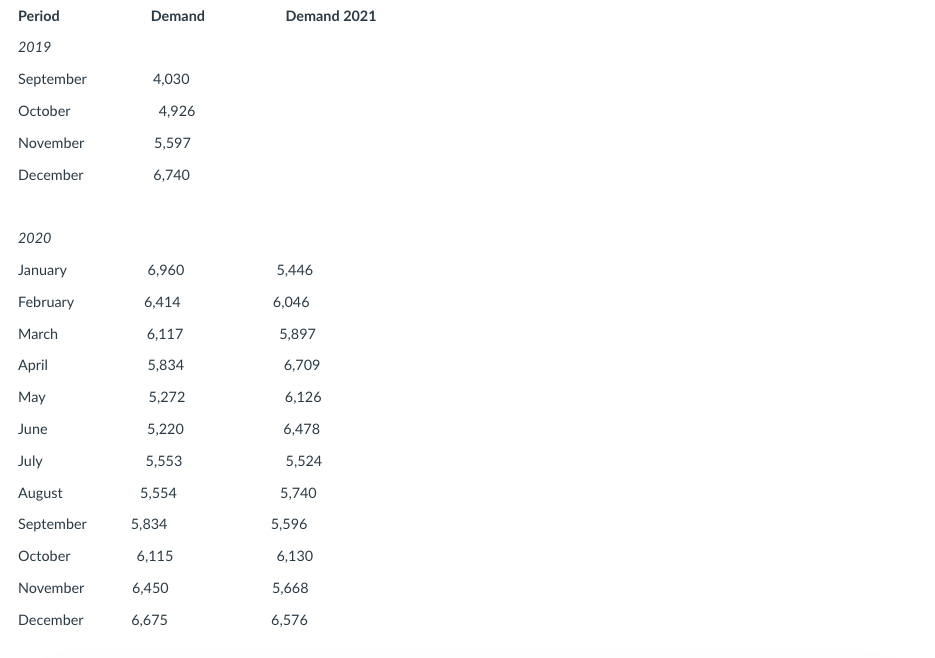
- Develop the forecast using the demand data in the first column on the left; apply that forecast to determine error, etc., to the demand data in the column on the right (Demand 2021)
- For all forecasts, round to a whole number; .5 and above round up; less than .5, round down
- Keep two decimal places for dollar figures (e.g., $100.27)
- For numbers with decimals keep two decimals (e.g., 10.03); without whole numbers, keep four decimals (e.g., 0.8743)
- Inventory value per case (net cost) = $75.00
- Stockout cost per case = $125.00
- Inventory carrying cost = 30%
- Exponential smoothing January forecast = 6,000 cases
For this problem, you will need to develop three types of forecasts:
- Simple moving average (use four months)
- Weighted moving average (four-period with alpha = 0.5; alpha-1 = 0.25; alpha-2 = 0.15; alpha-3 = 0.10)
- Exponential smoothing with alpha = 0.4
For each type of forecast, you will another column titled cost. If demand is greater than the forecast, there will be a stockout cost. If demand is less than the forecast, there will be an inventory carrying cost.
For weighted moving average and exponential smoothing, keep decimal points for each month, then sum them and round up or down the final forecast. Round up with 0.5 or higher, round down with less than 0.5.
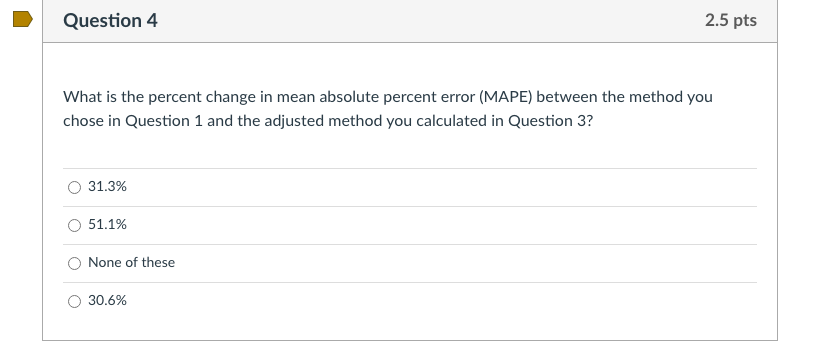 Which would be the correct answer?
Step by Step Solution
There are 3 Steps involved in it
1 Expert Approved Answer
Step: 1 Unlock

Question Has Been Solved by an Expert!
Get step-by-step solutions from verified subject matter experts
Step: 2 Unlock
Step: 3 Unlock