

Question: Develop the Gantt chart and obtain the slack time for each task include: Correct start and end dates for the tasks, Slack time, Gantt chart.
Develop the Gantt chart and obtain the slack time for each task
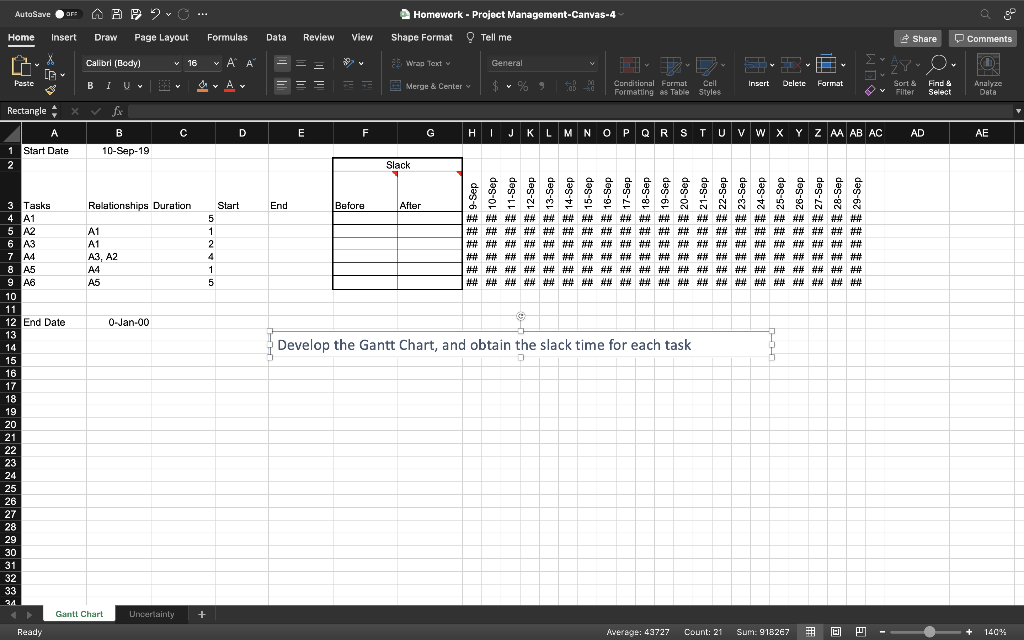
include: Correct start and end dates for the tasks, Slack time, Gantt chart.
A Gantt chart is a type of bar chart that illustrates a project schedule, named after its popularizer
AutoSave OF APvc .. A2 Homework - Project Management-Canvas-4 Home Insert Draw Page Layout Formulas Data Review View Shape Format Tell me Share Comments Calibri (Body) v 16 ~ A X G 2 Wrap Text General - Lav FD Paste B 1 Uv Av = = Insert Format Delete Merge & Center Y $ % ) Conditional Format Cell Formatting es Table Styles Sort & Filter Find & Select Analyze Data V Rectangle X B C C D E F G HIJ H I J K L M N O P Q R S T U V W X Y Z AA AB AC L 0 Q S W AD AE A 1 Start Date 2 10-Sep-19 I Slack Relationships Duration End Before After A1 A1 A3, A2 A4 A5 Start 5 1 2 4 1 5 ### 9-Sep #### 10-Sep 14 ## ## ## ## ### ## ## ## ## ## ## ## ## ## ## ## ## ## ## ## ## ## ## ## ## ## ## ## ## ## ## ## ## ## ## ## ## ## ## ## ## ## ## ## ## ## ## ## ## ## ## ## ## ## ## ## ## ## ## ## ## ## ## ## ## ## ## ## ## ## ## ## ## ## ## ## ## ## ## ## ## ## ## ## ## ## ## ## ## ## ## ## ## ### 0-Jan-00 3 Tasks 4 A1 5 A2 6 A3 7 A4 8 A5 9 A6 10 11 12 End Date 13 14 15 16 17 18 19 20 21 22 23 24 Develop the Gantt Chart, and obtain the slack time for each task 25 26 27 28 29 30 31 32 33 34 Gantt Chart Uncertainly + Ready Average: 43727 Count: 21 Sum: 918267 + 140% AutoSave OF APvc .. A2 Homework - Project Management-Canvas-4 Home Insert Draw Page Layout Formulas Data Review View Shape Format Tell me Share Comments Calibri (Body) v 16 ~ A X G 2 Wrap Text General - Lav FD Paste B 1 Uv Av = = Insert Format Delete Merge & Center Y $ % ) Conditional Format Cell Formatting es Table Styles Sort & Filter Find & Select Analyze Data V Rectangle X B C C D E F G HIJ H I J K L M N O P Q R S T U V W X Y Z AA AB AC L 0 Q S W AD AE A 1 Start Date 2 10-Sep-19 I Slack Relationships Duration End Before After A1 A1 A3, A2 A4 A5 Start 5 1 2 4 1 5 ### 9-Sep #### 10-Sep 14 ## ## ## ## ### ## ## ## ## ## ## ## ## ## ## ## ## ## ## ## ## ## ## ## ## ## ## ## ## ## ## ## ## ## ## ## ## ## ## ## ## ## ## ## ## ## ## ## ## ## ## ## ## ## ## ## ## ## ## ## ## ## ## ## ## ## ## ## ## ## ## ## ## ## ## ## ## ## ## ## ## ## ## ## ## ## ## ## ## ## ## ## ## ### 0-Jan-00 3 Tasks 4 A1 5 A2 6 A3 7 A4 8 A5 9 A6 10 11 12 End Date 13 14 15 16 17 18 19 20 21 22 23 24 Develop the Gantt Chart, and obtain the slack time for each task 25 26 27 28 29 30 31 32 33 34 Gantt Chart Uncertainly + Ready Average: 43727 Count: 21 Sum: 918267 + 140%Step by Step Solution
There are 3 Steps involved in it
1 Expert Approved Answer
Step: 1 Unlock

Question Has Been Solved by an Expert!
Get step-by-step solutions from verified subject matter experts
Step: 2 Unlock
Step: 3 Unlock