

Question: Direction: Use descriptive statistics in interpreting the data. Table 1: The Board Exam scores of Teacher Education graduates grouped according to the type of institutions
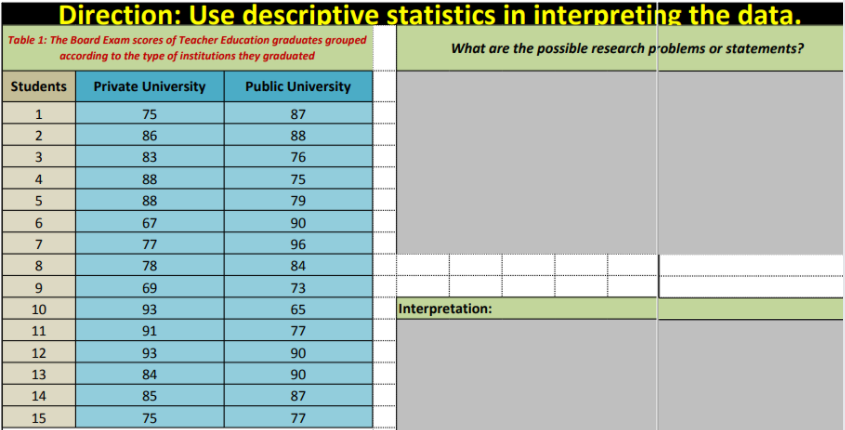
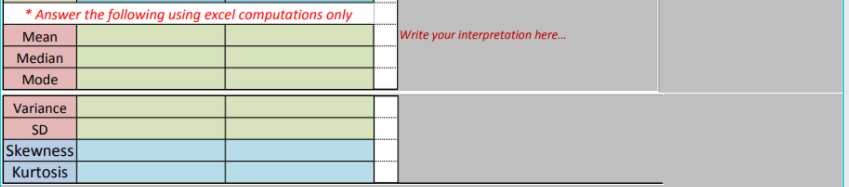
Direction: Use descriptive statistics in interpreting the data. Table 1: The Board Exam scores of Teacher Education graduates grouped according to the type of institutions they graduated What are the possible research problems or statements? Students Private University Public University H 75 87 86 88 83 76 88 75 88 79 67 90 77 96 78 84 9 69 73 10 93 65 Interpretation: 11 91 77 12 93 90 13 84 90 14 85 87 15 75 77* Answer the following using excel computations only Mean Write your interpretation here. Median Mode Variance SD Skewness Kurtosis
Step by Step Solution
There are 3 Steps involved in it
1 Expert Approved Answer
Step: 1 Unlock

Question Has Been Solved by an Expert!
Get step-by-step solutions from verified subject matter experts
Step: 2 Unlock
Step: 3 Unlock